Last month I had the pleasure of attending the fourth annual AEC Technology Symposium and Hackathon put on by Thornton Tomasetti's CORE Studio in New York City. The symposium kicked off with many fantastic speakers, I highly recommend checking out the full videos of the presentations over on the TT CORE Studio Youtube playlist. As with last year's symposium, I was personally most impressed with the work presented by Luc Wilson and Mondrian Hsieh demonstrating the use of computational design and custom digital tools for urban planning and visual analysis with Kohn Pedersen Fox's Urban Interface.
This year was also my first ever participation in a hackathon. I registered with the goal of teaming up with technology enthusiasts and individuals from other disciplines to see if I could help develop a solution for some of the pain points frequently encountered during the design and documentation process. My hope was that I could leverage my Dynamo knowledge and experience in frequently uncovering barriers in architectural practice to learn something about coding bespoke applications and user interfaces from those more familiar with the software side of the industry.

Image courtesy of Thornton Tomasetti CORE Studio
The goals of the hackathon were simple...
This event is organized for programmers, web developers, and AEC experts to collaborate on novel ideas and processes for the AEC industry. The focus will be on digital/computational technologies that have been used on projects, the lessons learned from them, and how it impacted the overall project workflows. The Hackathon aims for attendees to learn new skills, generate new ideas and processes for the AEC community through data-driven design and customized applications.
Everyone had approximately 24 hours to assemble teams, formulate an idea, and get to work trying to create a prototype. After the 24 hours, each team was to report out on what they had created and a panel of judges would determine the winners. For the first hour, individuals from the group of 60 or so hackers had a chance to pitch their ideas and attempt to attract a team. Following introductions, everyone mingled and quickly decided which topics they found most interesting and figured out what skill sets were required to fulfill the goals of the project.
The team I joined forces with all were attracted to an idea originally proposed by Timon Hazell:
When continuously exchanging Revit models among constituents on a building project, it is a time-consuming process to track down what changed between versions. In an ideal world, the architects, engineers, or consultants who are sending the updated model will write a summary or list the changes but this rarely actually occurs. Therefore, the traditional approach typically involves a painstaking process of opening both models simultaneously on separate monitors and spotting differences via visual comparison. Is there a better way to see what has changed between two versions of a Revit model and analyze just how much has changed throughout the project?
We ended up with a fantastic team of diverse perspectives to tackle this problem:
Me - represented the architecture side: knowledge of project delivery, recurring challenges, and opportunities for process optimization
Timon - represented the engineering side: spends significant time receiving and interpreting design intent from the architect with little documentation of changes
Charles - represented the consultant side: acoustician with decades of architecture experience, also regularly receives design intent from the architect and must intepret
Matt - represented the software side: experience developing custom digital tools and troubleshooting prepackaged software solutions to enhance AEC production

From left to right: Kyle Martin, Matt Mason, Charles Prettyman, Timon Hazell
The first step was to define the problem: what are all the factors that constitute a change in a Revit model? After some brainstorming we identified 4 key change types:
- Elements added to the model
- Elements deleted from the model
- Family type or information parameter changes
- Geometry changes: location, shape, or size
We set out to create a two-part solution to this problem. First, a C# Revit add-in that essentially acts as a "diff" to compare all Revit elements between two models and generate a list of viewable items. Second, a JSON file and accompanying Dynamo workflow that would produce a data visualization for targeting concentrations of changes throughout the project.
Our trusty C# guru Matt immediately began coding the Revit add-in while the rest of the team created sample Revit models and cartooned out the data visualization component. After many hours of relentless coding, the first add-in prototype was ready to test. With a few rounds troubleshooting we were able to isolate the first list of altered Revit elements and export the first JSON file. The parameters associate with each Revit element contained within the JSON file allowed us to start building a Dynamo definition to restructure and visualize the data using the Mandrill package from Konrad Sobon. By early morning we had a working Revit add-in that mostly accomplished what we were looking for and began working out the kinks in the Dynamo workflow. As time began to evaporate in the final hours, we scrambled to test and troubleshoot the tools, assemble our presentation, and develop documentation. Ultimately we decided on the name Metamorphosis to represent the transformation of Revit models over time and their evolution into thoroughly-coordinated built form.
At the end of the Hackathon, approximately a dozen projects were presented to the judges in 5-minute maximum time allotments. Our team tried our best to efficiently explain the initial idea and walk the crowd through how the tools developed were a viable solution that would be easy to deploy to the average Revit user. After some deliberation, the winners were announced and we were thrilled to find out that we took second place largely in part because of the practicality of the problem we chose and the willingness to share our solution as open source.
And the development didn't stop there...
Following the hackathon, the code was improved in the Revit add-in to fine-tune some of the desired features. In addition the Dynamo definition was cleaned of its hackathon-induced spaghetti and properly labeled. And most importantly, everything was updated and organized into a GitHub repository.
INTRODUCING "METAMORPHOSIS" - An Open Source Revit Change Analysis Tool
Running the model comparison add-in results in a list of Revit elements that can be filtered and re-sorted. Clicking on the categories and individual elements adds them to the selection in the active view and zooms to their location.

List of changed elements sorted By Category (left) or By Change Type (right)
Clicking the Color Elements button will apply Override Color in View to all elements that fall under 3 change types:
- Green - New Elements
- Blue - Geometry Change (size or shape)
- Red - All Other Changes: modifications to parameters, location, rotation, etc.
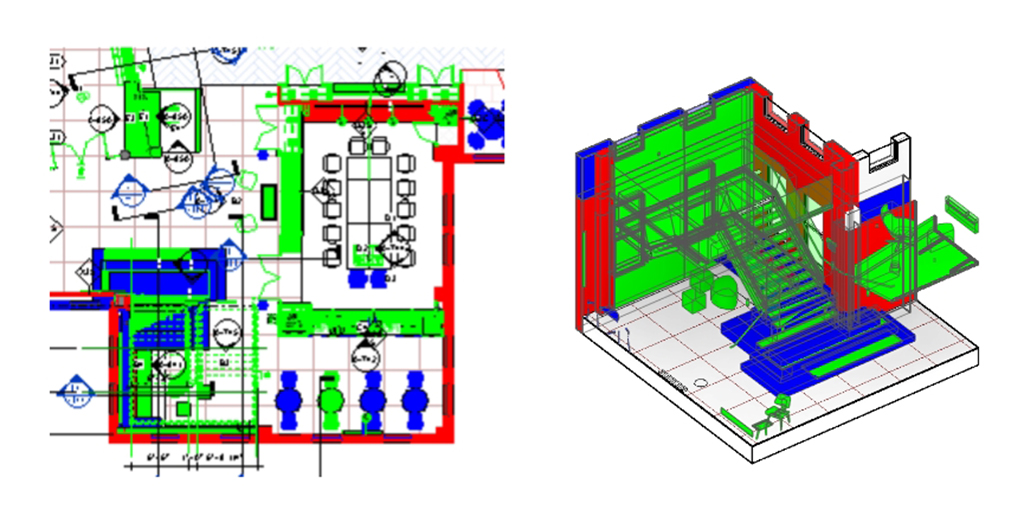
The Color Elements feature works any view type: plan, RCP, section, 3D axon, etc.
For some of the change types, an Analysis Visualization Framework (AVF) object appears:
- A box for an element that has been removed
- Arrow(s) for an element that has changed location (in the case of elements like walls, there are two location points so you get two arrows)
- A symbol if an element has been rotated
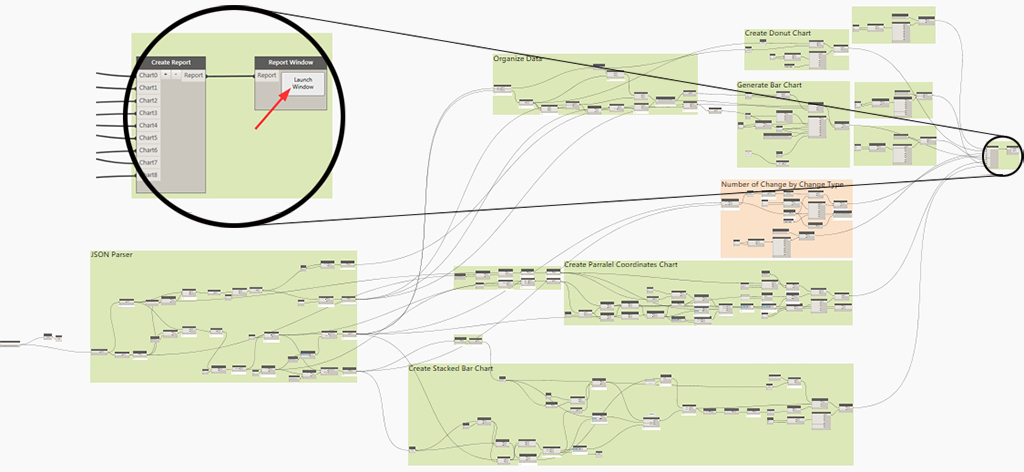
On the Dynamo side, opening the .dyn file and browsing to the exported JSON file will process the accompanying data for visualization in Mandrill. Clicking "Launch Window" in the Report Window node to the far right will open up the interactive data visualization window containing 4 chart types:
- Donut Chart (upper left) - number of changes by element type
- Stacked Bar Graph (upper right) - number of changes by change type
- Bar Graph (lower left) - percentage of items changed vs. total number of items for each category
- Parallel Coordinates (lower right) - number of changes for each level, each overlapping line represents a different Revit element category

METAMORPHOSIS VALUE SUMMARY
- colorize elements in any active view to quickly identify changes, much more efficient than previous methods
- color by change type allows you to target specific changes
- sorting, filtering, and element selection in add-in interface allows for quick location and isolation of elements
- quickly evaluate where most changes are occurring with analytics/visualization, this is particularly useful if the model comes with no documentation
- compare current state to any previous model, helpful to tell the story of location and amount of changes over time
- not just a tool for coordinating/viewing changes but making sure you cloud revisions as you go if the drawing set has already been issued
Interested in trying this tool out? Here is where you can access the datasets and learn more:
Github Repository
DevPost page
Presentation slides
Youtube Screen Capture Demonstration
In the end I got exactly what I wanted out of the hackathon experience. I was able to work with three individuals who possessing completely different skill sets than my own. I provided the team with background context and understanding of the problem from an architectural perspective so that we could devise a technological solution. More specifically, Timon and I pushed ourselves to utilize tools that we would not regularly encounter in practice and capitalize on the opportunity to learn the Mandrill package for Dynamo, JSON data formatting, Revit add-in configurations, and establishing a GitHub workflow for sharing and maintaining associated files.
A huge thank you goes out to the Thornton Tomasetti crew who worked so hard to put on such a well-executed event. Thanks to the judges who volunteered their time to hear all of our frenzied, sleep-deprived 5-minute-plus presentations. Lastly, shout out to my teammates who all worked tirelessly to make our idea a reality!