DynamoDC - Precision Inquisition

Last week I had the pleasure of presenting [remotely] to the DynamoDC user group. Timon Hazell reached out to ask if I would be willing, and since he had so generously served as our guest lecture for the Dynamo-litia September 2016 meeting, I was more than happy to return the favor. Apparently DynamoDC has previously hosted several intro to Dynamo workshops so he asked if I could demonstrate a more advanced example of how Dynamo can be used to extend Revit functionality.

One of my favorite things about AEC community outreach through user groups, conferences, and hackathons are that I am exposed really interesting problems that I would not have encountered in my own work. At the beyondAEC Hackathon the week before, one of the participants had asked me if there was a way to use Dynamo to isolate the exterior facade material areas and types specifically corresponding to a room in the building. I figured DynamoDC would be the perfect opportunity to tackle this workflow and the PRECISION INQUISITION: Advanced Extraction of Revit Model Information Using Dynamo presentation was born...

Image 1_DynamoDC_precision inquisition.jpg

Revit models are powerful repositories of geometric, numeric, and descriptive building information, however the default tools for accessing that information are often limited and cumbersome. Recent questions have been raised about utilizing Dynamo to execute precise tasks such as performing quantity takeoffs on specific portions of an exterior facade, comparing vision glass to room area, or even evaluating the proportion of total facade area by building orientation. Special guest Kyle Martin will deliver a [remote] live demonstration of advanced model analysis approaches with Dynamo. Topics covered will include: visual programming principles, general logic, list management, list at level, filtering and sorting, index tracking, querying Revit parameters, geometric properties, color for clarity, and much more.

In the hour of available presentation time I hoped to cover the following ambitious list of concepts:

  • basic visual programming principles
  • general logic
  • list management
  • list at level
  • filtering and sorting
  • index tracking
  • querying Revit parameters
  • geometric properties
  • color for clarity

As I prepared for the presentation, the Dynamo workflow grew increasingly complex.

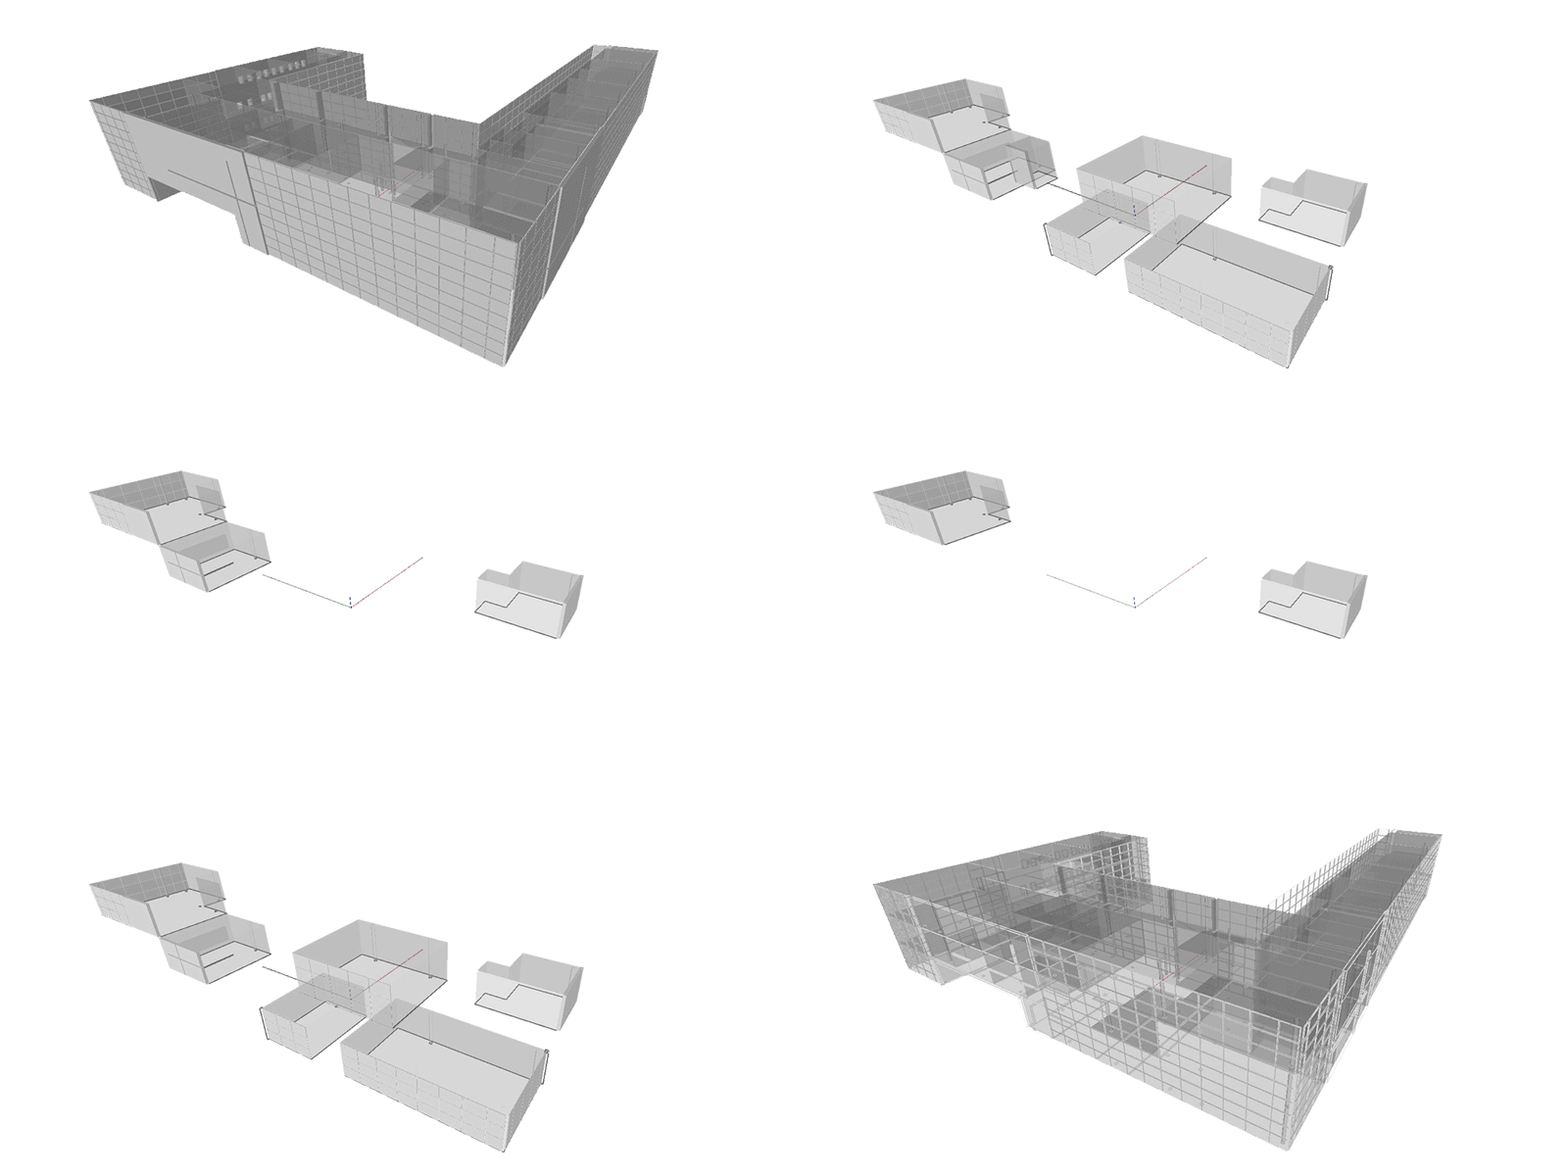
The principal function of the Dynamo definition was to query exterior wall geometry from the model based on a room number and perform material takeoffs, directional composition, and visual analysis.

OBJECTIVES: Target specific rooms in the Revit model by Room Number, isolate the exterior Wall/Window elements specific to that room, calculate total area of exterior facade for each Room, understand composition of vision to solid materials, and ass…

OBJECTIVES: Target specific rooms in the Revit model by Room Number, isolate the exterior Wall/Window elements specific to that room, calculate total area of exterior facade for each Room, understand composition of vision to solid materials, and assist with code calculations such as light & ventilation.

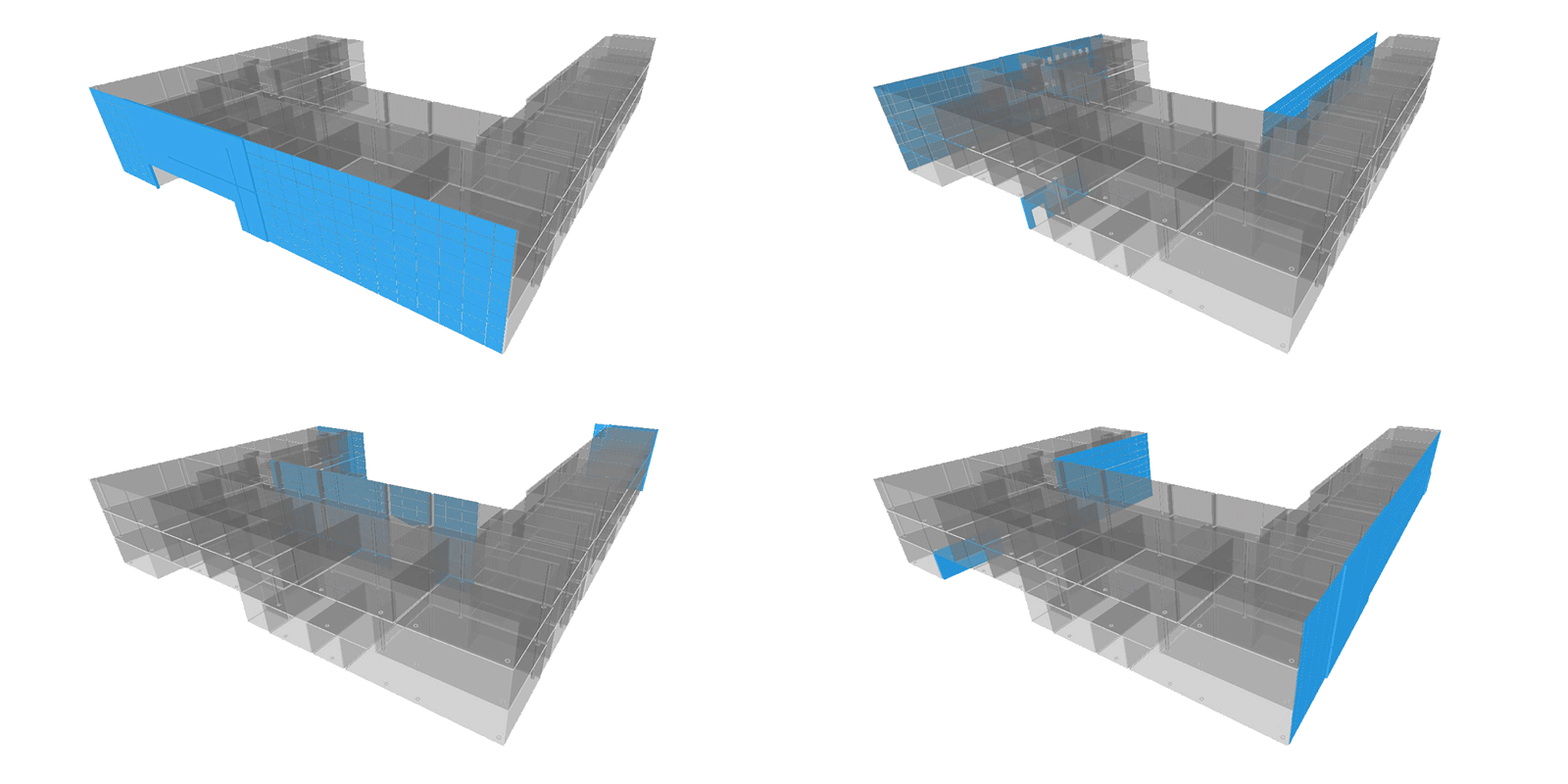
OBJECTIVES: Query all exterior Wall elements, use the underlying geometry to determine direction of each wall, sort walls by cardinal directions or bespoke orientation system, and calculate proportion of facade areas for each direction.

OBJECTIVES: Query all exterior Wall elements, use the underlying geometry to determine direction of each wall, sort walls by cardinal directions or bespoke orientation system, and calculate proportion of facade areas for each direction.

OBJECTIVE: Color specific items for analysis, visual clarity, and storytelling

OBJECTIVE: Color specific items for analysis, visual clarity, and storytelling

The live demonstration was recorded for your viewing pleasure. You may notice the video starts a little late due to technical difficulties but no significant content was missed. Presentation slides and the Dynamo file can be accessed HERE.

Even with a rush towards the end, I was able to successfully make it through all the content. I appreciate the audience being super receptive and patient given the hands-off format. And a very special thank you Timon Hazell, John Schippers, and Dana De Fillippi for the opportunity.

DynamoDC audience

DynamoDC audience

Kyle's "home studio" setup

Kyle's "home studio" setup

The other day I received a surprise t-shirt in the mail as a thank-you, I will wear it with pride!

Image 5_DynamoDC t-shirt.jpg

AEC Technology Hackathon 2016


Last month I had the pleasure of attending the fourth annual AEC Technology Symposium and Hackathon put on by Thornton Tomasetti's CORE Studio in New York City. The symposium kicked off with many fantastic speakers, I highly recommend checking out the full videos of the presentations over on the TT CORE Studio Youtube playlist. As with last year's symposium, I was personally most impressed with the work presented by Luc Wilson and Mondrian Hsieh demonstrating the use of computational design and custom digital tools for urban planning and visual analysis with Kohn Pedersen Fox's Urban Interface.

This year was also my first ever participation in a hackathon. I registered with the goal of teaming up with technology enthusiasts and individuals from other disciplines to see if I could help develop a solution for some of the pain points frequently encountered during the design and documentation process. My hope was that I could leverage my Dynamo knowledge and experience in frequently uncovering barriers in architectural practice to learn something about coding bespoke applications and user interfaces from those more familiar with the software side of the industry.

Image courtesy of Thornton Tomasetti CORE Studio

Image courtesy of Thornton Tomasetti CORE Studio

The goals of the hackathon were simple...
This event is organized for programmers, web developers, and AEC experts to collaborate on novel ideas and processes for the AEC industry. The focus will be on digital/computational technologies that have been used on projects, the lessons learned from them, and how it impacted the overall project workflows. The Hackathon aims for attendees to learn new skills, generate new ideas and processes for the AEC community through data-driven design and customized applications.

Everyone had approximately 24 hours to assemble teams, formulate an idea, and get to work trying to create a prototype. After the 24 hours, each team was to report out on what they had created and a panel of judges would determine the winners. For the first hour, individuals from the group of 60 or so hackers had a chance to pitch their ideas and attempt to attract a team. Following introductions, everyone mingled and quickly decided which topics they found most interesting and figured out what skill sets were required to fulfill the goals of the project.

The team I joined forces with all were attracted to an idea originally proposed by Timon Hazell:
When continuously exchanging Revit models among constituents on a building project, it is a time-consuming process to track down what changed between versions. In an ideal world, the architects, engineers, or consultants who are sending the updated model will write a summary or list the changes but this rarely actually occurs. Therefore, the traditional approach typically involves a painstaking process of opening both models simultaneously on separate monitors and spotting differences via visual comparison. Is there a better way to see what has changed between two versions of a Revit model and analyze just how much has changed throughout the project?

We ended up with a fantastic team of diverse perspectives to tackle this problem:
Me - represented the architecture side: knowledge of project delivery, recurring challenges, and opportunities for process optimization
Timon - represented the engineering side: spends significant time receiving and interpreting design intent from the architect with little documentation of changes
Charles - represented the consultant side: acoustician with decades of architecture experience, also regularly receives design intent from the architect and must intepret
Matt - represented the software side: experience developing custom digital tools and troubleshooting prepackaged software solutions to enhance AEC production

From left to right: Kyle Martin, Matt Mason, Charles Prettyman, Timon Hazell

From left to right: Kyle Martin, Matt Mason, Charles Prettyman, Timon Hazell

The first step was to define the problem: what are all the factors that constitute a change in a Revit model? After some brainstorming we identified 4 key change types:

  1. Elements added to the model
  2. Elements deleted from the model
  3. Family type or information parameter changes
  4. Geometry changes: location, shape, or size

We set out to create a two-part solution to this problem. First, a C# Revit add-in that essentially acts as a "diff" to compare all Revit elements between two models and generate a list of viewable items. Second, a JSON file and accompanying Dynamo workflow that would produce a data visualization for targeting concentrations of changes throughout the project.

Our trusty C# guru Matt immediately began coding the Revit add-in while the rest of the team created sample Revit models and cartooned out the data visualization component. After many hours of relentless coding, the first add-in prototype was ready to test. With a few rounds troubleshooting we were able to isolate the first list of altered Revit elements and export the first JSON file. The parameters associate with each Revit element contained within the JSON file allowed us to start building a Dynamo definition to restructure and visualize the data using the Mandrill package from Konrad Sobon. By early morning we had a working Revit add-in that mostly accomplished what we were looking for and began working out the kinks in the Dynamo workflow. As time began to evaporate in the final hours, we scrambled to test and troubleshoot the tools, assemble our presentation, and develop documentation. Ultimately we decided on the name Metamorphosis to represent the transformation of Revit models over time and their evolution into thoroughly-coordinated built form.

At the end of the Hackathon, approximately a dozen projects were presented to the judges in 5-minute maximum time allotments. Our team tried our best to efficiently explain the initial idea and walk the crowd through how the tools developed were a viable solution that would be easy to deploy to the average Revit user. After some deliberation, the winners were announced and we were thrilled to find out that we took second place largely in part because of the practicality of the problem we chose and the willingness to share our solution as open source.

And the development didn't stop there...

Following the hackathon, the code was improved in the Revit add-in to fine-tune some of the desired features. In addition the Dynamo definition was cleaned of its hackathon-induced spaghetti and properly labeled. And most importantly, everything was updated and organized into a GitHub repository.

INTRODUCING "METAMORPHOSIS" - An Open Source Revit Change Analysis Tool
Running the model comparison add-in results in a list of Revit elements that can be filtered and re-sorted. Clicking on the categories and individual elements adds them to the selection in the active view and zooms to their location.

List of changed elements sorted By Category (left) or By Change Type (right)

List of changed elements sorted By Category (left) or By Change Type (right)

Clicking the Color Elements button will apply Override Color in View to all elements that fall under 3 change types:

  1. Green - New Elements
  2. Blue - Geometry Change (size or shape)
  3. Red - All Other Changes: modifications to parameters, location, rotation, etc.
The Color Elements feature works any view type: plan, RCP, section, 3D axon, etc.

The Color Elements feature works any view type: plan, RCP, section, 3D axon, etc.

For some of the change types, an Analysis Visualization Framework (AVF) object appears:

  1. A box for an element that has been removed
  2. Arrow(s) for an element that has changed location (in the case of elements like walls, there are two location points so you get two arrows)
  3. A symbol if an element has been rotated

On the Dynamo side, opening the .dyn file and browsing to the exported JSON file will process the accompanying data for visualization in Mandrill. Clicking "Launch Window" in the Report Window node to the far right will open up the interactive data visualization window containing 4 chart types:

  1. Donut Chart (upper left) - number of changes by element type
  2. Stacked Bar Graph (upper right) - number of changes by change type
  3. Bar Graph (lower left) - percentage of items changed vs. total number of items for each category
  4. Parallel Coordinates (lower right) - number of changes for each level, each overlapping line represents a different Revit element category

METAMORPHOSIS VALUE SUMMARY

  • colorize elements in any active view to quickly identify changes, much more efficient than previous methods
  • color by change type allows you to target specific changes
  • sorting, filtering, and element selection in add-in interface allows for quick location and isolation of elements
  • quickly evaluate where most changes are occurring with analytics/visualization, this is particularly useful if the model comes with no documentation
  • compare current state to any previous model, helpful to tell the story of location and amount of changes over time
  • not just a tool for coordinating/viewing changes but making sure you cloud revisions as you go if the drawing set has already been issued


Interested in trying this tool out? Here is where you can access the datasets and learn more:

Github Repository
DevPost page
Presentation slides
Youtube Screen Capture Demonstration


In the end I got exactly what I wanted out of the hackathon experience. I was able to work with three individuals who possessing completely different skill sets than my own. I provided the team with background context and understanding of the problem from an architectural perspective so that we could devise a technological solution. More specifically, Timon and I pushed ourselves to utilize tools that we would not regularly encounter in practice and capitalize on the opportunity to learn the Mandrill package for Dynamo, JSON data formatting, Revit add-in configurations, and establishing a GitHub workflow for sharing and maintaining associated files.

A huge thank you goes out to the Thornton Tomasetti crew who worked so hard to put on such a well-executed event. Thanks to the judges who volunteered their time to hear all of our frenzied, sleep-deprived 5-minute-plus presentations. Lastly, shout out to my teammates who all worked tirelessly to make our idea a reality!

Dynamo-litia Boston - October 2016


This second Dynamo-litia workshop featured a live demonstration of modifying Revit parameters using Dynamo.

Workshop Description:
Back by popular demand! This session will showcase several practical workflows for everyday Revit production. If you are still wondering how Dynamo applies to the work regularly performed in architecture firms, this is the perfect chance to find out. The majority of the meeting will be devoted to a live demonstration and attendees will be encouraged to follow along. No prior Dynamo experience necessary; users of all levels welcome.

When: October 20, 2016
Where: BSA Space - Boston

More information at the Boston Society of Architects.

Apologies for the abrupt ending. The battery on the recording device died right before resolving and fully explaining the Element.SetParameter function but this video contains 99% of the relevant content. Presentation slides and datasets can be downloaded HERE.

Ceiling Alignment Made Easy(ier) with Dynamo


Rectangular ACT ceiling grid alignment is a task that frequently occurs during the design and documentation of architecture projects in Revit. After a ceiling has been placed, the typical approach involves creating a dimension string between two parallel walls and one of the gridlines in the ACT ceiling, selecting the dimension, and clicking the EQ symbol that automatically centers that gridline between the surrounding walls. This process must then be repeated for the perpendicular orientation.

For a more efficient workflow using Dynamo:

  • create a new Generic Model family
  • in the family editor, go to the Manage tab > Object Styles
  • in the Object Styles menu under Model Objects, click New under Modify Subcategories
  • name the new object DYNAMO and change the color to something bright that will be easily identified in the RCPs
  • in elevation, create a new reference plane and connect a dimension string between this and the Ref. Level
  • in plan, draw a rectangle the same size as one ACT tile (1’x1’, 2’x4’, etc.)
  • also draw a line at the midpoint of each direction to determine the center point of one tile
  • make sure that the lines are assigned to the upper reference plane so that they will be positioned near to the ceiling
  • in the Family Types dialogue, create a new parameter for Offset Height — this will be assigned to the dimension string in elevation and will determine the offset distance from the floor to the ceiling. It can be a Type parameter (same for EVERY instance of the family) or an Instance parameter, which would place at a default height and then allow adjustments for ceiling height variation in the project.

Not all projects are perfectly orthogonal. In some cases, there may be a defined angular shift in portions of the building, if not many unique angles. A secondary group of lines could be copied and pasted to the same place then assigned On/Off visibility parameters for an orthogonal and angled variation of the family. An instance parameter for the angle would allow for a custom rotation of up to 90 degrees on every instance in the project.

Once your family is completed, save and load into the Revit model. A Dynamo definition can then be built that targets ceiling elements in the model, queries their center point, and places the alignment family.

Ceiling Alignment - Dynamo Definition (hi-res image available HERE)

Ceiling Alignment - Dynamo Definition (hi-res image available HERE)

I chose to specifically isolate ceilings by Type and also by Level. This helps cut down on the requisite computation power and time that it takes the task to run. Another advantage is being able to open an RCP view, watch the families instantiate, and verify that everything has been configured correctly in Dynamo.

After the alignment families have been placed, users on the team can begin the task of manually aligning the ceiling grids to the red box. If it is determined that there is not sufficient space between the gridline nearest to the perimeter walls, the centerline crosshair of the family can be used instead to perfectly center the ceiling grid in the room instead.

Because the lines in the alignment family have been created with the name DYNAMO under the Generic Models category, it is easy to turn off their visibility through the project for final documentation via the View Template. Additionally, if ceiling have shifted and the positioning of the families becomes obsolete over time, it is easy to select one instance, right-click and select all in the view or project, then delete them entirely.

Given a minimum of 5 mouse clicks for the traditional process, selecting the Align tool (or typing the AL hotkey), picking a line on the alignment family, and then a gridline requires a few less clicks. Multiplied over dozens or even hundreds of ceilings throughout the project, this approach is vastly more efficient and removes the need for extra decision making.

One must still manually account for the minimum distance between the perimeter walls and the grid. And obviously this approach is not ideal on L-shaped and irregular ceiling profiles. However, the majority of ceilings in projects are rectangles and Dynamo can help production staff quickly work through an entire RCP full of ceilings so they can quickly apply their time to other pressing matters.

Automated Room Placement From Existing Drawings

Sometimes the only resource for existing conditions on a project are scans of original architectural drawings, often produced decades earlier. Scanning the drawings converts them into a digital form but these are flattened images from which no smart information can be extracted. Tracing walls, stair locations, and other building elements on top of a linked image underlay is relatively easy in Revit. Rooms however present a more difficult challenge because they are only represented by a text label and therefore many rooms may occupy the same open space. For example, a corridor may contain several appendages or alcoves that do not have physical elements separating them. This task becomes much more time consuming when placing a few hundred rooms across several levels of an existing building, which I was recently tasked with.

I began this investigation by converting the PDF scans into JPG files and opening them in Photoshop where I could quickly isolate the room names only. Once isolated, use a combination of the Gaussian blur tool, inverse select, and black color fill to convert the room name locations into a larger black blob then export each floor as a new JPG.

In Dynamo import the JPG containing the black blobs and scan the image for black pixels using the Image.Pixels and Color.Brightness nodes. You may have to try out several pixel values — using a large number in the xSamples input will generate too large of a pixel array and will take a long time to run, using too small a number may cause the node to miss some of the block blobs.

Rooms from Existing - Dynamo Definition (hi-res image available HERE)

Rooms from Existing - Dynamo Definition (hi-res image available HERE)

The Color.Brightness node returns a list of values between 0 and 1 that correspond to the brightness found in each pixel. Using some list management techniques, the list is inverted and then all white pixels (0s) are filtered out and only the darkest values (largest) are used to isolate the points where text values are located on the existing plan. Circles are created at all of the remaining points, with the radius defined by the corresponding darkness values. The entire list of circles should be matched against itself to group all intersecting circles because the Color.Brightness node may have read multiple block pixels in each text blob. Then extrude all the circles as solids, intersect any joining geometry, and use the Solid.Centroid node to determine the center point of each solid, which in theory should be the location point of each text label on the existing plans. A Count node can be used to evaluate the resulting number of text location points and determine if the total count of black blobs read in Dynamo closely matches the total number of room names labeled in the PDF scan.

If the counts are significantly different, adjust the pixel value sliders in the beginning of the definition to create a more or less dense field of points and re-trace the process up to this point. If the counts are close, the next step is to query the traced existing conditions walls from Revit model for the corresponding level. This can be done using combination of GetAllElementsOfCategory with the Category walls and then filtering only the elements on the same level.

Once the walls appear in Dynamo, you will most likely see that the resulting points from the existing plans will not be at the right scale, orientation, and location as the Revit walls. Placing a Geometry.Scale and Geometry.Node between the list of solids and the Solid.Centroid node will allow you to experiment with various scale and rotation values prior to the creation of final points. After some trial and error and visual approximation, you should be able to scale and orient the cluster of points to a configuration that matches the scale of the Revit model -- each point should look like it lands in the center point of each room.

Even after scaling and rotating the points, they may still be located off to the side of the Revit walls. To coordinate locations between Revit and Dynamo, begin by going to Manage > Setup > Line Style in Revit and create a new line called Dynamo. In the floor plan view of the level you are working on, pick a prominent element (such as a corner of the building) and draw a model line and change it to the newly created Dynamo line style. Back in Dynamo, use the Select Model Lines by Style node from the Archi-Lab package to locate the "Dynamo" line in Revit. Get the location at the start of that line using the Curve.Start node and also the location of origin in Dynamo with the Point.Origin node. A vector can now be established between these two points and used to translate all of the room locations scanned from the JPG to the same location as Revit. Note that moving from the Dynamo origin to the line drawn at the Level in plan should also move the room points to the correct elevation.

Once everything appears to line up correctly, the Tool.CreateRoomAtPointAndLevel node from the Steam Nodes package will place rooms at each point in the Revit model. For open areas such as corridors, multiple rooms will now be overlapping, potentially causing Warnings. The last step is to go through the model and draw room separation lines at logical points where divisions should occur between the room elements.

After every room has been separated in Revit, the process of populating Room Names, Numbers and other parameters is a manual one. However, if you are lucky enough to possess a CAD file for the existing conditions, Dynamo can also be used to populate the newly-created Room elements with text parameters. Begin by importing the CAD file into the Revit model and move it to the correct location. As a best practice, I tend to delete and purge all unnecessary layers in the CAD file prior to import -- in this case you may save a one-off of room text only and import that instead. In Revit if you explode an imported CAD drawing, the text will become actual Revit text objects (learn more HERE). With Dynamo, all text objects can be grouped into clusters based on shared location, matched up with the Room element center points, and then populate the associated elements with parameter information: Name, Number, Space Type, etc. Due to incongruent alignment or the use of leader lines, this workflow will most likely not work for every text item from the CAD plan but it may alleviate a large portion of the manual data entry required to populate the Revit room elements. More about this process in a future post...

Although a Dynamo-based approach requires some trial and error, it allows you to quickly place a large quantity of Revit Room elements in the exact same location as a scanned drawing. Knowing that the room locations are correct allows for quicker naming and parameter manipulation using Dynamo or other means and reduces a portion of monotonous work.

Dynamo-litia Boston - April 2016

Dynamo is a proven tool for modifying Revit information and automating repetitive tasks, yet figuring out where to get started can be an intimidating process. Please join us for the first in a two part series on how to begin using Dynamo. We will focus on what it is useful for and highlight several introductory workflows that can be understood with everyday Revit knowledge. Since Dynamo is new to the majority of the local AEC community, we will discuss how regular project challenges can be opportunities to explore principles and grow knowledge. For those who are already experts of other software platforms, see how Dynamo has made the process of transferring geometry and information easier than ever before.

The video and presentation slides are available HERE.

More information at the Boston Society of Architects.

Common Selection Methods Using Dynamo


The Dynamo visual programming add-in for Revit enables advanced information gathering, rapid model changes, and repetitive task automation previously not available with the out of the box tools. Working with robust Building Information Models often requires surgical list management -- the act of gathering, filtering, re-structuring, sorting, or otherwise altering clusters of data or information. Of all possible list management operations, the ability to target and isolate information is essential. In my experiences using Dynamo I have encountered many methods for selecting and isolating model elements, parameters, and numeric values in Revit. The following are some of the most common approaches that I find myself using time and again.


SELECTION BASICS:

As an introduction to selecting items from a list I will be using the English alphabet (26 characters) as my dataset and I am searching for the letter D. Below are descriptions for four of the most common selection nodes. Notice how the output of each use a "true" or "false" value. This is called a boolean operation -- a computer science term for anything that results an either of only two outcomes (binary): true/false, yes/no, 1/0, black/white, etc.

  1. Contains - this node produces a true/false result to whether the list contains any occurence of the letter D (plugged into the "element" input port). Although the outcome is true meaning yes the list contains the letter D, this will limit us from being able to isolate this letter in later operations.

  2. List.ContainsItem - similar to the Contains node, this node also searches the entire list for the letter D. However by changing the lacing to Longest -- right click the symbol in the lower corner (see red square), go to Lacing, and click "Longest" -- the letter D is checked against every item in the alphabet and the only true value returned is at Index 3 where D resides. The downside of this approach is that a sublist is created for every item in the alphabet meaning that we would need to flatten the list -- collapse everything back into one list of true/false values -- before continuing on to further operations.

  3. String.Contains - this node is excellent for searching through lines of text for a particular word or select group of words. In this case since the alphabet list only contains a single letter at every index, this node can be used to find the letter D. However, if the list contained the names of fruit and we searched for the letter "a", the node would return true values for any word containing an "a" such as banana, apple, pear, etc. For this reason, using the node to search for singular items can be problematic.

  4. == (match) - the double equals sign is a symbol that comes from computer science where a singular equals sign indicates a math calculation therefore two equals signs means that something is "the same". This is my favorite node to use for selection operations because it will find matches for any input type whether a string, number, piece of geometry, or Revit element.

After using the contains/match nodes above to determine true/false values, the output can then be paired with the List.FilterByBoolMask node to split the outcome into two separate lists. In this case, using the == node generates a true value at Index 3 and false for all the rest. This list of true/false values is plugged into the List.FilterByBoolMask node as a mask to filter the original alphabet letters. The outcome is the letter D isolated into its own list.


SELECTING MULTIPLE ITEMS:

Oftentimes when working with a BIM model, you are looking to match multiple values at once. Building on the list management principles above, you can easily search the alphabet list for more than one letter. Inputing more than one letter into the == node requires that you switch the lacing to "Cross Product" (see small red square) because you are attempting to match multiple items against a list of multiple items, meaning that you need to pair all possible combinations. The result is a list of 3 true/false values for each letter in the alphabet since the == node is attempting to match the letters F, R, and X for each. Since we are checking for any match of those three letters, using the combination of List.Map and the List.AnyTrue node from the Clockwork package will comb through each list and identify whether any matches occur. The last step is to feed the new list of true/false values into the List.FilterByBoolMask node and the letters F, R, and X are separated from the rest of the alphabet.

I recently discovered a second approach to isolating a list of search items. Using the NullAllIndecesOf node from the SpringNodes package combs through a list and returns the Index number of any matching items. This can then be used in concert with the List.GetItemAtIndex node to extract the values from the original list at the matching indeces. This node works especially well if the list being searched has repeat instances of the values you are searching for. Also notice how there is no more need for the use of boolean (true/false) values as an intermediary step.


ADVANCED SELECTION - REVIT ELEMENTS:

The above list management principles can be applied to isolating and extracting elements from Revit. For example if you want to gather a list of all the chair families placed in a Revit model:

  1. The combination of Furniture in the Categories node and All Elements of Category will generate a list of all furniture families.
  2. Since we only want chairs, grouping the model elements by their family name will create organized sublists.
  3. The grouped sublists can then be searched for the word "Chair".
  4. Since the model elements are grouped in multiples of the same family, the combination of List.Map and the List.AnyTrue node from the Clockwork Package will check every sublist to see if any of the items contain a true boolean value for the text "Chair" in the family name. Another method for doing the same thing would be to use List.Map in concert with List.FirstItem, which would extract only the first true/false value from every sublist.
  5. The last step is to use List.FilterByBoolMask to filter out only the grouped sublists of Revit model elements that contain a boolean value of true.

One advantage of understanding list management principles is that tasks can be achieved from multiple approaches. Here is another variation of the above method for collecting all chairs in the model:

  1. Use the nodes Categories: Furniture and All Elements of Category to extract all of the furniture families.
  2. Get the name of each family and look for those that contain the word "Chair".
  3. Filter out all elements that did not yield a true value using the List.FilterByBoolMask node. As a means of verification you can insert some Count nodes to check how many families have been identified as chairs vs. other.
  4. Given that all of the model elements coming from the In output port of the List.FilterByBoolMask node, the final operation is to group all of the elements according to their family name. In theory this will get you the exact same results as the previous method.

There is an even easier way to select model elements, once again by using the NullAllIndecesOf node from the SpringNodes package:

  1. Collect all furniture families from the model.
  2. Use the NullAllIndecesOf node combined with the name of the families and the List.UniqueItems node to identify the individual indeces where matching items reside in the list and group them according to their shared family names.
  3. Feeding the sublists of indeces into List.GetItemAtIndex will extract the model elements from the original furniture list and group them accordingly.
  4. The last step would be to filter out only the chair family groups (not shown in the image).

Specific families or parameter values can be isolated using the == (match) node:

  1. Collect all furniture families from the model.
  2. Use the == node to compare a specific chair name against the list of family names to produce a list of corresponding true/false values.
  3. Filter out all of the Revit model elements that contain a true boolean value with List.FilterByBoolMask.
  4. Optional: apply a Count node to get the total number families placed in the model for that specific item.

Please keep in mind that these examples are only some of the methods for selecting and isolating items using list management and they may not necessarily be the best methods. Different tasks and model configurations will require different approaches but the more time spent practicing list management, the easier it will become to customize a solution for any problem.

For more on list management I highly recommend that you take a look at Chapter 6 of the Dynamo Primer . Also, check out this excellent post by LandArchBIM .

Design Space Exploration with Dynamo


One of the most challenging aspects of the architectural design process is determining how to organize form to fit an overall parti. Facing endless possible geometric configurations, making sequential alterations towards a fitting result can be difficult without a means to measure suitability. During the initial phases of design research, an architect gathers essential information such as program requirements to meet a clients needs, zoning and code information for a provided site, environmental and material influences, and aesthetic preferences. These assets serve as the foundation for a constraints based design approach where parameters can be assigned in an effort to influence and control form.

Constraints in design are rules or vocabularies that influence form through the design process. An inherent feature of the architectural process is that design must be performed within a set of given parameters. Parameters help to focus the scope of an architect by narrowing the range forms and formal relationships may take within a design solution... Constraint based design takes the parameters associated with a design problem and links them to the attributes of the formal components and relationships of a solution. (Dustin Eggink, http://goo.gl/EktbQ1 )

Dynamo is an ideal platform for constraints based design because the visual programming environment allows you build a parametric model that can be quickly adjusted with changes to input values.

Once you have a functioning Dynamo definition, all of the nodes can be consolidated into one Custom Node by dragging a selection window over everything and going to Edit > Create Node From Selection. This will transition everything to the custom node editing mode -- you can always tell when you are in this mode because the background is yellow.

To create a custom node, the first step is to give it a name, description of what it does, and category (where it will be saved in the Library). All of the input number blocks (far left side) must be swapped out for Input nodes, generally named for the variable they represent. Output nodes also need to be added after the final nodes in the definition (far right side) that are providing the finalized geometry. When these steps are complete, save the node. Back in the Dynamo node space -- also known as the canvas -- number sliders can be added to the newly-created custom node. It is helpful to click the down arrow on the left side of the node to set the minimum, maximum, and step interval because large numbers can take awhile to process or crash Dynamo while zeros will often create null values and turn the majority of your definition yellow with warnings. Now you have a fully parametric custom node that allows you to explore a range of formal configurations with the simple adjustment of number sliders.

Developing custom nodes for form making allows for use with the Dynamo Customizer -- a web-based viewer currently in beta for viewing and interacting with Dynamo models real-time. This platform has a lot of potential for sharing designs in the future and allowing colleagues or clients to experiment with their own manipulations of the design.

Check out this example for the twisting tower here: Dynamo Customizer - Twisting Tower.
DISCLAIMER: you will have to request Beta access and sign in with your Autodesk ID to view this. For step-by-step instructions, visit: http://dynamobim.org/dynamo-customizer-beta-now-available/.

After guiding parameters have been established, a design space can be generated for testing all possible variations of a few select variables of a design. Design space exploration is a concept involving a virtual -- or non physical -- space of possible design outcomes. This allows the designer to simultaneously see a wide range of options and extract only those that satisfy pre-determined criteria of fitness.

The core essence of this workflow is the use of Cartesian product which facilitates comparison of all possible pairings of variables. This mathematic operation can be understood as an array of combinations between x, y, z and 1, 2, 3 (below left) or as a slope graph of all possible correlations between the two lists of variables (below right).

Using the List.CartesianProduct node calculates all possible combinations of the number range values however all of the geometry is instantiated in Dynamo at the origin point, making it appear that only one object was created even though the count shows 132 (below left). Thanks to Zach Kron and the Design Options Layout node from the Buildz package, the nested list clusters of geometric objects are arrayed according to the Grid Size spacing value (below right). Using list management logic -- such as List.Transpose, List.Map with List.Transpose, etc. -- before the Design Options Layout node will re-arrange the list structure and result in different compositions of objects.

To set up a design space in Dynamo, the inputs to the custom node are fixed values. Whichever variables that you want to test must be left empty on the custom node and number ranges are connected to the List.CartesianProduct node. The number of list inputs in List.CartesianProduct must match the number of inputs left open on the custom node. It is also important to note that the list order for the number ranges in the List.CartesianProduct node must correspond to the same order of inputs in the custom node. The total number of values from each number range will not only determine the scale and form of the resultant geometry but count of values in each list will determine the overall size and shape of arrayed objects -- this is critical to remember because an excessive number of input values may take several minutes to process or potentially crash Dynamo. After the ranges of values have been set up, the List.CartesianProduct node is connected to the Design Options Layout node which arrays all possible combinations in 3D space. Depending on the geometry being tested, the Grid Size input determines the spacing between objects. When everything is connected correctly, Dynamo will display an array of forms which can be altered by changing the number range inputs and re-running the definition. If Dynamo crashes, geometry disappears, or there is an insufficient amount of variation in the forms, continue to calibrate the number ranges and explore the limitations of the parameters in your custom node.

A successful design space arrays all possible options along two or more axis utilizing the concept of dimensionality. Design space is theoretically unlimited, however the visualization of the virtual design space is limited to the constraints of graphic representation. Color can be added to provide visual differentiation of a third dimensions such as the analysis of generated outcomes, or could represent any of the associated properties of variables. Criteria for evaluation of fitness refers to the means by which the best solution is determined.

For example, a calculation of height of twisting tower forms can be colorized on minimum to maximum gradient (below left). Another representational technique is selective omission or hierarchical modifications to the representation (below right).

Ultimately design space and its subsequent representation is nothing more than a tool, designers still have to make decisions. Design space should function as a method of exploration to make informed, confident, substaintiated decisions.


Portions of this blog post were developed in collaboration with Jamie Farrell for our course Advanced Revit and Computational Workflows taught at the Boston Architectural College.

Dynamo-litia Boston - January 2016

As the Dynamo visual programming add-in for Revit continues to emerge as an essential tool for design and production, questions surrounding justification and strategies for implementation have arisen. Recent topics for discussion include the emerging role of computational design, open source vs. proprietary development, and funding innovation. The advantages and capabilities are well documented but what sort of impact can be expected on staffing and project planning? Please join us to hear more about how Dynamo is being managed in the local community and contribute to the ongoing conversation of how firms can better position themselves.

The video and presentation slides are available HERE .

More information at the Boston Society of Architects .

Converting Space Planning Families to Revit Room Elements


A few weeks ago at the, Dynamo-litia Boston meeting a fantastic question was raised:

After using the space planning objects for programming in Revit, what happens when you need to transition that information to rooms?

This poses a legitimate challenge because the space planning objects are families and the information associated needs to be converted rooms - fundamentally different Revit elements.

Just days after the Dynamo-litia meeting I was presented with the opportunity to transform a Revit model full of intricately-arranged space planning objects across multiple Levels into Revit room elements. With some effort in Dynamo, I found a way to extract the name, department, and other parameters from each space planning object and generate Revit rooms in exactly the same spot with corresponding information.

Areas to Rooms_definition.png

Using this workflow, 639 programming families became Revit rooms in just under 90 seconds.

The Dynamo definition collects all instances of the Space Planning families in the model, groups them by Level, and locates the centroid of each. Using the Tool.CreateRoomAtPointAndLevel from the package Steamnodes, a room is placed at each centroid in the list with their associated levels.

The one caveat to successful conversion is taking the time to model Revit walls between the space planning objects. Consistency in setting up walls between objects and maintaining thorough parameter information within the objects will eliminate the possibility of creating Not Enclosed or Redundant rooms. Worst case, if rooms are overlapping within the same enclosed area after running Dynamo, you know that the centroid of the room is at the center point of the Space Planning family and you can add additional walls between those centroids to create separation between room elements.

The last step is to remove or hide the visibility of the space planning objects from the model and then you can perform Tag by Category to tag all rooms on each floor.

What I Use Dynamo For Nearly EVERY Day


PARAMETER CHANGE CUSTOM DEFINITION

Working on architectural projects in Revit requires changes to the parameters of model elements on a daily basis. If only a handful of items need to be adjusted, the parameters can easily be modified by clicking the elements one-at-a-time. Yet oftentimes decisions are made on the project requiring the change of dozens or even hundreds of elements throughout the model - an extremely time-consuming process when executed individually. Common mothods for making mass changes to model elements are through Revit Schedules or by exporting parameter information to outside applications such as Excel via Ideate BIMLink and similar add-in products. However, there is even easier way to accomplish this...

Using the Dynamo visual programming add-in for Revit, parameters associated with Revit elements can be isolated and changed with the simple arrangement of a few nodes. This method is much faster and provides greater control than can be achieved from schedules and other tools because specific criteria of the parameters can be targeted and isolated. Once the Dynamo definition is built, the tool can be re-used every time future parameter changes are necessary. For this reason, I implement this approach nearly every day on projects. This tutorial will show you how to build a parameter change definition of your very own.

STEP 1 - set up the definition:
The four nodes on the far left are: the Revit element category that you want to make changes to, the specific parameter that needs to change, the existing name or value, and the new name or value. The name of the parameter and the existing values must match the exact spelling and capitalization as in the model. These values can be verified by going to the Revit model and selecting one of the elements to be changed or by creating a schedule.

Parameter Change_1_original definition_edit.jpg

STEP 2 - package the definition into a custom node:
Drag a window around all the nodes to select and go to Edit > Create Custom Node.

Parameter Change_1_original definition.jpg

STEP 3 - name the custom node:
Fill out the Name of the node and write up a brief description of what it does. The Category is what the node will be filed under in the Dynamo library for future use.

Parameter Change_3_custom node details.png

STEP 4 - place custom node on the canvas:
This is what the finished product looks like.

Parameter Change_4_custom node.png

STEP 5 - input changes:
When creating a custom node from a selection, Dynamo will automatically assign inputs to all open variables. To make a tool that can easily be understood by other future users, it may be beneficial to change the names of the Input nodes.

STEP 6 - putting the custom node to use:
Match the requisite Revit element Category, parameter name, and values to quickly change all instances of a particular element in your model.

AEC Technology Symposium 2015

AECTS2015_nametag.jpg

AEC Technology Symposium 2015
Hosted by Thornton Tomasetti (NYC)
Baruch College
September 25th, 2015

RESEARCH & DEVELOPMENT IN AEC SESSION 1:
Measurement Moxie
Christopher Connock - Kieran Timberlake

Christopher Connock emphasized the importance of approaching each architecture project as an experiment — an opportunity to test new technology and ideas — a philosophy that Kieran Timberlake incorporates into all of its projects. They are particularly exploring the frontier of data capture using a wireless sensor network to gather building performance analytics. The comparison of plant diversity and placement against soil moisture and temperature sensors in a green roof can help assess drainage, plant health, and solar gain over time. Temperate and relative humidity sensors can be used to investigate an entire space or focus on a particular application such as the performance of materials in a building envelope. Hundreds of different sensors placed throughout a building can track and transmit environmental changes across a given day or even across seasons. Kieran Timberlake implemented a wireless sensor network to help inform their renovation of their new offices in the Ortlieb Bottling Plant in Philadelphia and then developed an in-house app to capture post-occupancy feedback from their own employees about the overall comfort of the space and to identify abnormal conditions. All of this research contributed to the development of tally — a life-cycle assessment (LCA) app and add-in for Revit that evaluates the environmental impact of building materials among design options and promotes a much more eco-conscious approach to design.

Grow Up, Grasshopper!
Andrew Heumann - NBBJ

Andrew Heumann believes in the need to change the perception of design technology in the AEC industry and integrate it more into practice. He showcased an extensive portfolio of projects that have used Grasshopper for Rhino and custom written apps to simulate inner office traffic patterns and the importance of sight lines, the use of human location and city data for urban planning, and the tracking of digital tools in the office to identify focus areas for development and support. All scripts and tools developed in-house at NBBJ are documented and packaged into products for use by project teams. In addition, custom dashboards and user interfaces help reduce intimidation and increase universal adoption — for example, reducing a complex Grasshopper script to a series of slider bars that control the inputs of a parametric design. Andrew also advocated for the use of hackathons and similar hands-on user meeting formats to promote design technology as a facet of culture and process. He shared an example of how a brief hackathon with senior partners at NBBJ led to the funding of a proposal for further development of an innovative tool for optimizing healthcare patient room configurations.

Evolving Modes of R+D in Practice
Stephen Van Dyck and Scott Crawford - LMN Architects / LMN Tech Studio

The Tech Studio was founded to support the prominent role of research and development at LMN Architects in Seattle, which led to an expanded use of analytic and generative tools to drive design. They have not only embraced the use of custom digital tools for the creation and visualization of complex forms but regularly construct scale models for material testing and to explore modular strategies as part of their iterative design process. Working with fabrication in mind facilitates improved precision for collaboration with engineers and consultants. In addition, they have found that a thorough digital process and physical models help better communicate design ideas thus resulting in increased positive community feedback. The development of a ray-tracing tool for exterior acoustics studies, custom panel creation for balance in musical acoustics and aesthetics, and a highly parametric pedestrian bridge spanning a major Seattle highway are a few examples of projects that demonstrate how research is guiding principal for design at LMN.

OPEN-SOURCE DATA AND APPLICATION:
Collaboration and Open Source - How the Software Industry’s Approach to Open Sourcing Non-Core Technology Has Created Innovation
Gareth Price - Ready Set Rocket

This presentation provided insight to the current state of technological innovation through the lens of a digital advertising agency. Gareth Price emphasized that individuals should not be hesitant to share ideas out of fear that another company will benefit from them. Particularly in the AEC industry, companies do not have the overhead to for pay tool creation and requisite support, nor can they cover the cost to pay an outside software consultant. The reality is that other people are busy with their own work and do not have the time nor resources to steal your ideas and commodify them. More importantly, it is advantageous to share ideas for a project because they may elicit constructive criticism, or inspire others to contribute to those ideas and improve them. Also, do not get too entrenched on one idea and know when to pivot — the next great idea may come as an unexpected derivative of the original intention.

Key quotes:
"purpose is the DNA of innovation"
"failure is the new R&D"

How Opens Source Enables Innovation
Mostapha Roudsari and Ana Garcia Puyol - CORE studio / Thornton Tomasetti

Mostapha Roudsari and Ana Garcia Puyol exhibited many examples of digital tools that have emerged out of CORE Studio - the research and development arm of Thornton Tomasetti. The majority of examples presented originated during previous CORE AEC Technology Hackathons and were then further developed into more robust products. Nearly every tool required collaboration from multiple individuals, with expertise in a diverse mix of software platforms, and oftentimes representing different companies. The takeaway from this presentation was the value of open source and hackathons as a means for getting a group of talented people into one room to create new tools for AEC design and representation. Mostapha wanted to make it clear that more important than software tools, code, and machining is the strength and power of the user community. If you want to be at the forefront of the movement, be a developer, however the community is just as important make an effort to share ideas and spread adoption.

Here are some of the many tools presented:

  • vAC3: open source, browser-based 3D model viewer. This project led TT to further develop Spectacles.
  • Spectacles: allows you to export BIM models to a web interface that allows you to orbit in 3D, select layers, and access embedded BIM information (demo HERE)
  • VRX (Virtual Reality eXchange): a method for exporting BIM models for virtual reality viewing via Google Cardboard
  • DynamoSAP: a parametric interface that enables interoperability between SAP2000 (structural analysis and design), Dynamo, and Revit
  • Design Explorer: "an open-source web interface for exploring multi-dimensional design spaces"
  • Pollination: "an open source energy simulation batch generator for quickly searching the parameter space in building design"

For more information, check out TT CORE Studio's GitHub, Projects, and Apps pages

Open Source: Talk 3
Matt Jezyk - Autodesk

Matt Jezyk provided an introduction to Dynamo including its history and the most recent developments. Dynamo may have started as a visual programming add-in for Revit but it is quickly transforming into a powerful tool for migrating data and geometry across numerous software platforms. The talk highlighted the role open source has played in the empowering independent developers to create custom content that expands capabilities and makes interoperability possible. By keeping Dynamo open source, it has benefited from contributions by individuals with a wide range of expertise looking to satisfy specific requirements. As part of a larger lesson taken from the growth of Dynamo, Matt emphasized that the key to the emerging role of technology in practice and the AEC industry as a whole is less about learning specific tools but about codifying a way of thinking — tools are only the implementation of a greater plan.

DATA-DRIVEN DESIGN
Beyond Exchanging Data: Scaling the Design Process
Owen Derby - Flux.io

Flux has been a frequent topic of conversation lately. The company initially marketed a product called Flux Metro which boasted the potential for collecting the construction limitations of any property based off zoning, code, municipal restrictions, and property records — an ideal tool for developers and architects to assess feasibility or use as a starting point for the design process.

The company has since pivoted to focus on creating a pipeline for migrating and hosting large quantities of data for many software formats. Their new product line features an array of plugins for transferring data between Excel, Grasshopper, and Dynamo, with plans to release additional tools to connect to AutoCAD, SketchUp, Revit, 3DS Max and more in the near future. Data exported from these software programs is hosted to a repository in the cloud where it can be archived and organized for design iterations and option investigation. Flux has great potential for achieving seamless interoperability of data and geometry between software platforms, and significantly improving the efficiency of AEC design and production process.

Holly Whyte Meets Big Data: The Quantified Community as Computational Urban Design
Constantine Kontokosta - NYU Center for Urban Science + Progress (CUSP)

The NYU Center for Urban Science + Progress (CUSP) is using research to learn more about the way that cities function. Buildings, parks, and urban plans are all experiments built on assumptions in which the true results don’t emerge until years and decades later. How do you measure the “pulse” of a city? How do macro observables arise from micro behavior? Constantine and CUSP have set out to test these questions by collecting and analyzing: NYC public internet wireless access points, Citi bike share, 311 complaint reporting, biometric fitness devices, and social media. They use these urban data sources to make better decisions and form initiatives for future community improvement projects. The results also have positive implications for city planning, city operations, and resilience preparation.

Data-Driven Design and the Mainstream
Nathan Miller - Proving Ground

Nathan Miller is the founder of the Proving Ground, a technology consultancy for Architecture, Engineering, Construction, and Ownership companies. In his experiences providing training and technological solutions he professes the importance of equipping staff with the right tools and knowledge to adequately approach projects. There is an intersection between managers and leaders responsible for projects and staffing, and those who are actually doing the work. It is imperative to focus on outcomes and not get deterred by the process.

The Biggest IoT Opportunity In Buildings Is Closer Than You Think
Josh Wentz - Lucid

Energy consumption, mechanical systems data, thermal retention, and other metrics are not recorded for the majority of buildings worldwide. These are incredible missed opportunities for evaluating the overall performance of a building and collecting real-time research that can inform better construction techniques. Lucid has developed a product called BuildingOS that offers 170 hardware integration options to collect robust building data. This data has the potential for helping facilities management departments better track efficiency and maintenance of their systems, in addition to contributing to the international pool of data to help us better understand how materials and systems perform over time.

RESEARCH & DEVELOPMENT IN AEC SESSION 1
Capturing Building Data - From 3D Scanning to Performance Prediction
Dan Reynolds and Justin Nardone - CORE studio / Thornton Tomasetti

This presentation highlighted CORE Studio's use of various technologies for capturing existing conditions data and testing architectural responses through computation. They have utilized drones for capturing the condition of damaged buildings and structures by assembling fly-by photos into a point cloud.The development of in-house GPS sensor technology accurate to 1 centimeter anywhere in the world has enabled measuring the built environment and construction assemblies to a high level of precision. CORE Studio has also investigated the use of machine learning for exploring all possible combinations of building design parameters and calculating embodied energy predictions. All of these design technology advancements are helping Thornton Tomasetti design more accurate better-informed systems.

Data-Driven Design
Luc Wilson - Kohn Pedersen Fox Associates PC

Luc Wilson thinks of data as an “Urban MRI” - a diagnostic tool for measuring the existing configuration of cities and predicting future growth. Multiple FAR and urban density studies were presented that exhibited how comparison to precedents and benchmarks helps to conceptualize the data and make visual sense of the analysis. The key to prediction is the ability to test thousands of designs quickly, which Luc has perfected by developing digital tools for quickly computing all possible combinations of input parameters and producing measurable outcomes for comparison. One of the most exciting portions of the presentation was the mention of a 3D urban analysis tool called Urbane, which Kohn Pederson Fox is working with NYU to develop — could this be the new replacement for Flux Metro?

Cellular Fabrication of Building Scale Assemblies Using Freeform Additive Manufacturing
Platt Boyd - Branch Technology

Platt Boyd founded Branch Technology after realizing the potential for 3D printing at a large scale by imitating structures found in nature. Branch has dubbed their technique “cellular fabrication” where economical material is extruded with geometric complexity to construct wall panels that are lightweight and easy to transport. Their process seeks to reduce the thickness required by traditional 3D printing technologies and the intricate geometric structure provides equivalent strength to that of a printed solid. The wall panels are printed free-form with a robotic arm on a linear track and then are installed onsite where insulation, sheathing, and finish material are added to reflect the same condition as traditional wood or metal stud construction. It will be really interesting to see Branch continue to refine their methods and start to tackle complex wall conditions for use in real-life building projects in the near future.


Watch videos of all the presentations HERE.

Getting Started with Dynamo

I am frequently asked how I got started using Dynamo so I will take a moment to share my background and provide advice for making your first foray into the world of computational BIM.

I have been using Dynamo for less than a year with no prior visual programming experience and it has made a significant impact on the way I approach production. For all of the advancements that BIM has provided to the AEC industry, operational constraints in Revit consistently challenge the efficiency of production. Since entering the architecture profession, working on several project teams has revealed that every project requires repetitive tasks at some point, oftentimes meaning making changes to Revit elements one-at-a-time. To make matters worse, fluctuations in design direction, scope, or value engineering can necessitate a complete overhaul of portions of the model and lead to re-doing those consecutive manual adjustments. Dynamo adds an additional layer of control to overcome Revit limitations by providing the capability to gather and restructure information and elements in the model, thus creating the potential for repetitive task automation.

My best advice for getting started with Dynamo is to make time and find opportunities to use it. Identifying a specific problem will provide a framework with which to search for answers and guide your workflow. There are many wonderful developers out there who are sacrificing personal time to expand the capabilities of Dynamo and produce custom nodes for the Package Manager. In the spirit of Open Source, the worldwide community is generally willing to share knowledge and answer questions in the hope that more people will contribute ideas. It is important to keep in mind that demonstrations and documentation are intended to provide examples of what can be achieved. There isn’t a universal Dynamo definition that addresses multiple problems, every task requires slight modifications and customizations to correspond to the unique conditions of your project. Focus on the underlying principles of visual programming and embrace flexibility.

If you want to learn more about a Dynamo post you encountered, you can improve the chances for a quick response if you include sufficient information. I have had success in the past by including the following in an email:

  1. your question
  2. how long you have been using Dynamo
  3. what you are working on
  4. how you plan to apply this workflow
  5. what you have tried so far
  6. accompanying screenshots, sketches, diagrams

When it comes to resources, the tutorials on the Learn page of the Dynamo website are very helpful and I particularly encourage reading through the Primer to gain an understanding of the fundamental principles. Keep up with the latest news and tutorials by regularly checking the Dynamo Blog. The Dynamo Community Forum is an excellent place to post questions, responses are normally timely and everyone is friendly. Local Dynamo user groups have also been popping up around the globe, which are an excellent way to grow your network of individuals that you can reach out to for help and collaboration. There are currently groups in: Atlanta, San Francisco, Tokyo, Boston, Los Angeles, and Russia.

Lastly, there are many blogs produced by pure Dynamo enthusiasts that have helped me in my journey. I highly recommend that you check them out if you are looking for answers or inspiration:

Proving Ground (io) & The Proving Ground (org)
Archi-Lab
Buildz
Havard Vasshaug's blog
Simply Complex
What Revit Wants
Sixty Second Revit
AEC, You and Me
Jostein Olsen's blog
Revit beyond BIM
Enjoy Revit
Serial_NonStandard
Kyle Morin's blog
The Revit Kid
The Revit Saver
SolAmour's extensive list of resources

Listen to the Dynamo Team explain the history and recent popularity of Dynamo on the Designalyze Podcast.

Visualizing Rooms by Color with Dynamo

Using the Dynamo visual programming add-in, it is possible to isolate room geometry in a Revit model and color-code specific room types for the purpose of visualization. This workflow can be extremely helpful when trying to track down a lost room, visualize unit mixture, or analyze the adjacency and diversity of various rooms in the model. Ultimately this Dynamo method adds yet another tool that can be customized for a multitude of model validation tasks.

 FULL DEFINITION: Step 1 (green), Step 2 (blue), Step 3 (orange), Step 4 (magenta)


FULL DEFINITION: Step 1 (green), Step 2 (blue), Step 3 (orange), Step 4 (magenta)

Workflow:

Step 1: collect all Room elements from your Revit model by their room name parameter and then isolate the perimeter geometry of each.

Step 2: match the list of all rooms in the model against the name of one particular room you are looking for (String node in the red circle). Using the List.FilterByBoolMask approach, any null items (often due to unplaced or duplicate rooms) are filtered out that can potentially break the definition later on down the line. The perimeter lines of the filtered rooms are then used to generate a 3D extrusion of each room shape.

image 4.jpg

Step 3: the list of 3D room shapes is then passed to the Display.ByGeometryColor node to colorize in the Dynamo geometry preview mode. Each unique color requires an RGB color code. You can find custom RGB color values in Adobe Photoshop or Illustrator, or by going to websites such as Kuler and COLOURlovers .

image 4.jpg

Step 5: once the definition is set up for one room name, the central cluster of nodes can be copied for all other room names. If everything is correctly set up, a series of colored rooms will appear in the 3D geometry preview.

Step 6: for means of validation, a count can be taken of all rooms that have been collected from the Revit model and fully processed. Comparing this count to a schedule an Revit will verify whether all targeted rooms were accounted for and visualized in Dynamo or not.

With this approach, all rooms can in the Revit model can be queried, sorted, and visualized.

Additionally, this Dynamo definition can be simplified by utilizing advanced list management tactics, eliminating the need to copy the central of nodes for each unique room name.

Automated Feasibility Project


AUTOMATED FEASIBILITY PROJECT

A common circumstance of working with commercial development clients is producing feasibility studies to examine the value of pursuing a project on a particular site. Factors such as local zoning ordinances, building code, desired program, and site constraints all inform the buildable potential of a site and determine whether it is financially and strategically advantageous to invest in a project. Feasibility studies require the right balance of accuracy and efficient time management given the likelihood that many projects will not come to fruition.

My colleague Jason Weldon and I are currently embarking on a project to investigate the potential use of Dynamo for automating portions of the feasibility process. The two essential advantages to this approach are buying back time for deeper investigation and the validation of proposed schemes through iteration. Automation through Dynamo will significantly reduce initial preparation and manual input of information required to start a BIM model. Alteration of computational constraints will enact changes to the model for testing schemes and instantaneous calculations provide a report for each iteration. This process promotes efficiency and substantiates certainty.

Phase 1
Zoning Setbacks, Levels, Floor-to-Floor Height, & Courtyard

All studies begin with the same ingredients: a plot plan or civil drawing and preliminary zoning research. Working from these items alone, a maximum allowable building envelope can be established. Floor Area Ratio allowances and incentive zoning can be incorporated to evaluate proportional modifications to the overall envelope.

automated feasibility_phase 1.GIF

Here I start out by collecting the property line for a site from Revit. From the property line, I am able to establish setbacks on all five edges of the site. Constraints for the overall number of floors and floor-to-floor height allow to me to quickly explore different massing compositions. Inserting a courtyard facilitates improved residential potential for the site due to increased light and ventilation. By adjusting the distance of the courtyard from the exterior face of the building, it is possible to experiment with the proportional balance of form and floor area efficiency.

automated feasibility_definition

Download the open source definition here .

BLDGS=DATA

bldgs-data.png

BLDGS=DATA
Hosted by CASE Inc. (NYC)
The Standard High Line Hotel
May 28, 2015

Data For Understanding Cities
Blake Shaw, Head of Data Science - Foursquare

For those of you who have never heard of Foursquare, it was originally a mobile device app for sharing locations and activities with your social network - occasionally creating the opportunity for chance encounters when two friends find themselves in the same vicinity. Nowadays Foursquare has evolved into a powerful mechanism for tracking human behavior. With the exponential rise of people connected to the internet via mobile devices, how will the constant production of "data exhaust" be harvested and what can it tell us? How does a city behave as a living organism? What is the most popular activity on a hot summer day (answer: getting ice cream)? Foursquare continues to examine correlations among human behaviors and asks how we can better interact with the buildings we inhabit. Everyone experiences an environment differently but how can data derived from countless previous experiences be used to inform future experiences and provide valuable recommendations? Data is the key to optimizing the potential for enjoyable experience.

Data for Building Insight - Panel Discussion
Brian Cheng, Designer & Associate - HDR Architects Jennifer Downey, National BIM Manager - Turner Construction Peter Raymond, CEO - Human Condition

This session started off with each person sharing a little bit about technology efforts at their companies. At HDR they are utilizing a combination of a custom dashboard and parametric modeling to analyze health care program and massing test fits. In addition, advanced model sharing and co-location methods enable instantaneous coordination with engineers and consultants. Turner presented an example of how LEAN strategies, aggressive coordination and scheduling, thorough communication, all combined with robust project data have made a significant impact at their company and played a large part in the world record setting concrete pour at the Wilshire Grand in LA. Human Condition demonstrated a construction safety vest that tracks body position, biometrics, and worker location. With the further development of wearable technology, real-time information can be gathered on every worker at the construction site and a holistic safety culture can be established through the incentives of exemplary performance.

During the discussion it was pointed out that currently in the AEC industry there is a culture of "commodification of mistakes," meaning that contingencies are written into contracts, numbers are carried for unforeseen costs, and there is a standing assumption of labor inefficiencies and injuries on the job. How can BIM be better utilized to mitigate these costly errors and how can new technologies improve job safety and productivity? Perhaps tools like clash detection and co-location make for a more streamlined design and construction process. Furthermore, BIM as a platform needs to become a mode of communication between project constituents and facilitate a timely transmission of data. Another question that emerged was how can decades of on-site construction knowledge and experience be gathered and implemented much earlier on in the design and documentation phases? Strategies like pulling seasoned construction workers into the coordination meetings and using tools like a company intranet to archive knowledge and solutions were suggested. It is also imperative to seek feedback and document the process in order to ensure continuous improvement.

Data for Retail Roll-Out
Scott Anderson, VP Global Corporate Store Planning & Development - Estee Lauder Companies Melissa Miller, Exec. Director Corporate Store Planning & Development - Estee Lauder Companies

This team is responsible for identifying new opportunities for brand positioning within retail department stores and carrying out the requisite construction. After years of managing projects through email, Word, Excel, and Gantt charts it became apparent that tracking the transfer of information across multiple platforms was incredibly inefficient. The team set out to construct a custom dashboard that managed all communications, actions, specific information, and progress by project. Now project managers and company executives can enter the system at any time and review progress. The new system has enabled transparency and drastically reduced the duration of projects.

Data for Indoor Positioning
Andy Payne, Senior Building Information Specialist - CASE Steve Sanderson, Partner & Director of Strategy - CASE

With the emergence of indoor positioning systems that triangulate mobile device location using Bluetooth, wireless, and GPS, a team at CASE Inc. has embarked on a project to harness indoor location data. Using a custom app created to track employee movement throughout the workday, CASE recorded one month of data and produced this analysis. From this data, it was determined that only 2/3 of space is being actively utilized in this BRAND NEW office the company just moved into. In addition, some of the program was not being used as originally intended or seldom used at all. Disregarding the potential for future company growth, CASE has wondered how the results this post-occupancy analysis would have affected the planning of the office layout prior to signing their lease. This led to a larger conversation about the opportunity for implementation in design. For example, how can this technology be applied to doctors and nurses in a health care setting to monitor their daily routines and learn more about the way spaces are truly used? The potential for better understanding of human behavior and the development of theoretical simulations to analyze building program is very exciting.

More about the development of the app and beacon technology...

Data for Building Buildings - Panel Discussion
John Moebes, Director of Construction - Crate&Barrel Doug Chambers, CEO - FieldLens Todd Wynne, Construction Technology Manager - Rogers-O'Brien Construction

These three gentlemen discussed coordination and the use of data to avoid significant delays in project timeliness. At Crate&Barrel, many of the Autodesk software products are used on a small project team to design and build new stores throughout the world. Careful documentation allows the Crate&Barrel to bring the procurement of steel and materials in-house at a significant cost savings and drastically reduce the possibility of mistakes in the field that affect valuable components of retail design. FieldLens is a task management product that allows construction managers to better orchestrate the construction process. With the ability to assign particular tasks to specific individuals, save notes and images, review a 3D model and construction documents, and track workers on site, a superintendent can keep much better tabs on aspects of the job and managers can have a continual progress update on how the work is progressing.

Data for Galactic Growth
Roni Bahar, Exec. Vice Presedent of Development & Special Projects - WeWork

WeWork is a company that offers coworking office space worldwide via an hourly or monthly subscription model. In the last four years they have seen exponential growth leading to construction on an unprecedented scale to accommodate demand (12 new office locations in just the last year). In an attempt to manage this frenzy they have embraced modular construction as a method for standardizing construction technique, aesthetics, and material cost regardless of location or contractor. The kitchen units, cubicles, conference rooms, bathrooms, and common area furniture are all modular components built in Revit complete with detailed finish information, material takeoffs, and construction details. As much of a well-oiled machine the procurement and development arm of WeWork is, it was fascinating to hear that the one lacking component to the process is hard data and feedback. With such rapid growth and a relatively small project team, the company is building offices faster than research can be conducted to determine the success of the spaces they are producing. In the next few years as the WeWork begins to catch up with the pace, it will be interesting to see how they aggregate data to substantiate the success of the experience beyond sheer number of offices and dollars.

More on WeWork...

The BUILTRFEED team were also at the event and posted an excellent summary. Check it out!

Autodesk University 2014

Autodesk University
AU2014 Summary
December 2-4
Mandalay Bay, Las Vegas

Fusion 360 Digital Fabrication Workflows:

This course highlighted several features of Autodesk Fusion 360, a program that facilitates easy manipulation of 3D geometry otherwise difficult to achieve in Revit. After exporting a conceptual mass family from Revit to Fusion 360, an undulating wall form was created that could then be imported back into Revit, populated with curtain wall using adaptive components and rendered in a perspective street view with Google Maps background. That same form was imported into a program called Meshmixer that provides advanced options for preparing an STL file for 3D printing and allows you to apply custom supports. Altogether, the integrated workflow across several software platforms was relatively seamless and the course exhibited proof that very complex and customized geometry to be created in Revit for any project type.

Building a Good Foundation with Revit Templates:

Members of the architecture, engineering, construction and manufacturing industries gathered for this round table discussion about best practices for starting a project in Revit. Two methods were compared, the use of a Template File and Default Project. At Shepley Bulfinch, we use a template file at the outset of every project that contains a minimum amount of views, families and general standards to provide a good starting point. A default project has the advantage of carrying much more initial information including pre-placed families and objects but requires a significant time investment to keep the content current. Overall, the common sentiment in the room was that template files are easiest to maintain and offer the most versatility for any project type. Additionally, it is preferable not to “front load” Revit models and start out with unnecessary file size when one of the biggest challenges among all projects is keeping the model as small and responsive as possible.

Energy Analysis for Revit:

Are you familiar with the native energy analysis tool in Revit (hint: it’s under the Analysis tab on the ribbon)? This tool has the potential to be very helpful for early feedback to help drive the design. The task can be farmed out to the cloud for faster processing and to post reports for multiple options. For more in-depth analysis, the Revit model can also be exported to GBSxml format and opened in Green Building Studio, a cloud-based energy simulation platform. Relatively specific configurations are required within a model for the analysis to run successfully and one of the predominant takeaways of the course was the emphasis on modeling with energy analysis outcome in mind from the start of the project.

Challenges of LEAN Design and Computational Analysis:

This very engaging roundtable discussion examined the emerging role of computational analysis and generative design to help make more efficient design decisions. The keynote address at the beginning of the conference featured the use of "machine learning algorithms" where information and constraints are entered into a computer and simulations are run to determine an optimal design outcome. To start this session, we identified wastes and ineffective behaviors within each profession and in the collaboration process between. After a predictable round of architect-bashing, the question was proposed: "Does computation and simulation allow us to come to confident solutions earlier in the design process and reduce waste?" If existing condition information, user requirements, code constraints and many of the other variables that influence the design process can be programmed to generate permutations, is this a promising direction for the future of the profession? The group came to the conclusion that computational analysis and simulation will never be reliable enough to deliver a comprehensive design solution but may be helpful in providing direction at challenging moments in the process.

Practical Uses For Dynamo Within Revit:

Dynamo is a visual programming environment that allows you to make custom changes within Revit and extract information otherwise unattainable with the native program features. The program utilizes a user-friendly graphic interface to make adjustments within the Revit API (the "back end" which contains all the building blocks for how the program functions). This course demonstrated many entry-level uses for Dynamo including:

  • quickly making changes to all instances of a family type in a model (example: adjusting the offset height of all columns at once)
  • advanced family geometry (example: controlling profile order to create cantilevered and wrapped swept blends)
  • wrapping structure along curved surfaces
  • generating separate finish floor on top of slab automatically from room boundaries


Utilizing Revit Models for Architectural Visualization:

This course covered work flow and best practices for exporting a Revit model to the Unity 3D, a game engine that enables real-time visualization and walk-throughs. The first step is preparing the Revit model for export by cropping down only what you need with a section box and turning off unecessary categories in Visibility Graphics. Export the model to FBX and import it to 3DS Max where materials, cameras and lights are applied. Lastly the model is imported into Unity where perspectives, walk-throughs and animations can be utilized. In summary, Unity 3D provides a compelling presentation piece that may appeal to some clients but it is important to consider the time investment that goes into the preparation process.

Dynamic Energy Modeling:

An energy and environmental analysis consultant presented a multitude of methods for assessing daylighting, wind, weather, energy consumption and other performance characteristics of a design. Specific tools covered included eQUEST, Green Building Studio, Autodesk360 Lighting Analysis, raytracing and raycasting, Rushforth Tools Library, Autodesk Ecotect and more. Although these programs were generally too advanced for the level of in-house analysis we use at Shepley Bulfinch, I enjoyed learning about numerous ways information can be extracted from Revit and used to help inform the architectural design process.

Revit + Dynamo = The Building Calculator:

Beyond parametric modeling and making tweaks within Revit, Dynamo can be used to extract much of the information stored within a model. By using an "export to excel" function, areas, quantities, dimensions, room lists and so much more can be exported and analyzed with the powerful tools Excel has to offer. Schedules can be created, complex building calculations can be scripted and automatically updated upon every change within the model, or checks and balances for code and zoning can be integrated to produce reports. Items can then be adjusted, renamed or resized to push back into Revit from Excel and make direct changes to the model. Dynamo provides a giant step forward in the pursuit of harvesting the full potential of BIM.

The Great Dynamo Dig: Mine Your Revit Model:

With all this excitement surrounding Dynamo, did you know there is also a SQL export function? This allows for the creation of a much more comprehensive database that can be thoroughly organized using database management software and mined for analytics and appealing visual graphics in Tableau.