Last week I had the pleasure of presenting [remotely] to the DynamoDC user group. Timon Hazell reached out to ask if I would be willing, and since he had so generously served as our guest lecture for the Dynamo-litia September 2016 meeting, I was more than happy to return the favor. Apparently DynamoDC has previously hosted several intro to Dynamo workshops so he asked if I could demonstrate a more advanced example of how Dynamo can be used to extend Revit functionality.
One of my favorite things about AEC community outreach through user groups, conferences, and hackathons are that I am exposed really interesting problems that I would not have encountered in my own work. At the beyondAEC Hackathon the week before, one of the participants had asked me if there was a way to use Dynamo to isolate the exterior facade material areas and types specifically corresponding to a room in the building. I figured DynamoDC would be the perfect opportunity to tackle this workflow and the PRECISION INQUISITION: Advanced Extraction of Revit Model Information Using Dynamo presentation was born...

Revit models are powerful repositories of geometric, numeric, and descriptive building information, however the default tools for accessing that information are often limited and cumbersome. Recent questions have been raised about utilizing Dynamo to execute precise tasks such as performing quantity takeoffs on specific portions of an exterior facade, comparing vision glass to room area, or even evaluating the proportion of total facade area by building orientation. Special guest Kyle Martin will deliver a [remote] live demonstration of advanced model analysis approaches with Dynamo. Topics covered will include: visual programming principles, general logic, list management, list at level, filtering and sorting, index tracking, querying Revit parameters, geometric properties, color for clarity, and much more.
In the hour of available presentation time I hoped to cover the following ambitious list of concepts:
- basic visual programming principles
- general logic
- list management
- list at level
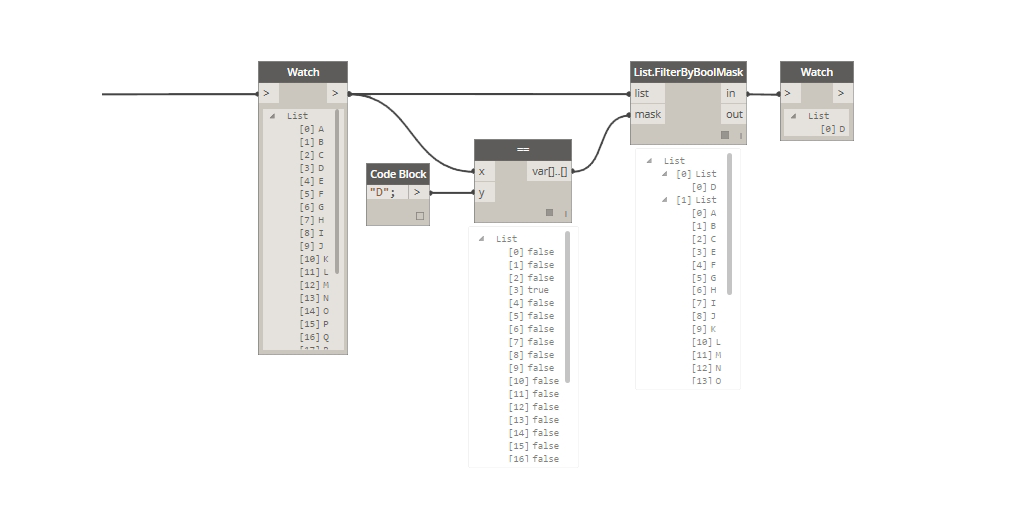
- filtering and sorting
- index tracking
- querying Revit parameters
- geometric properties
- color for clarity
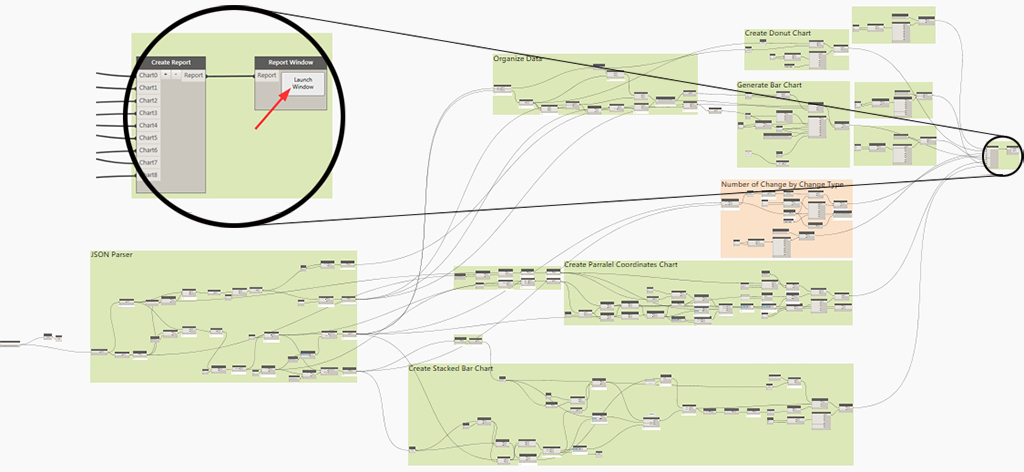
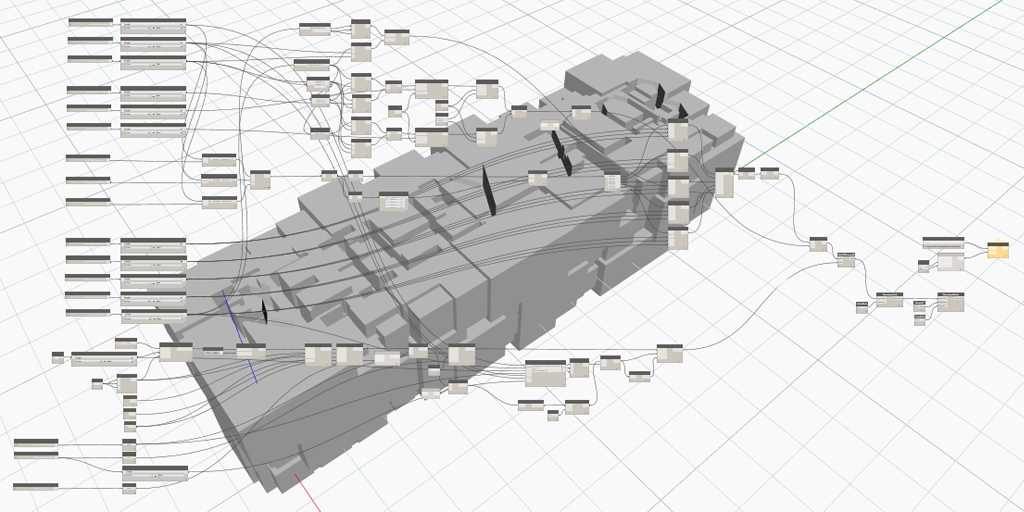
As I prepared for the presentation, the Dynamo workflow grew increasingly complex.

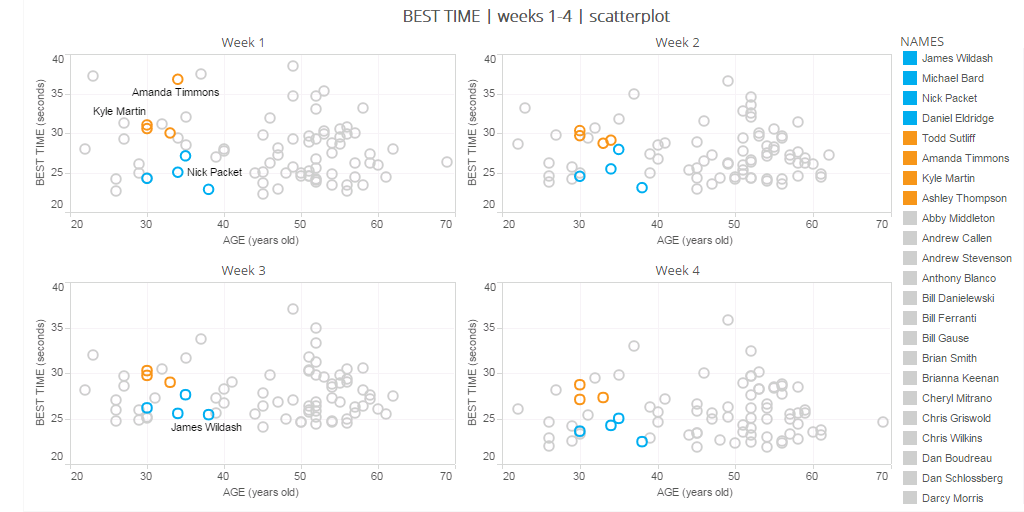
The principal function of the Dynamo definition was to query exterior wall geometry from the model based on a room number and perform material takeoffs, directional composition, and visual analysis.
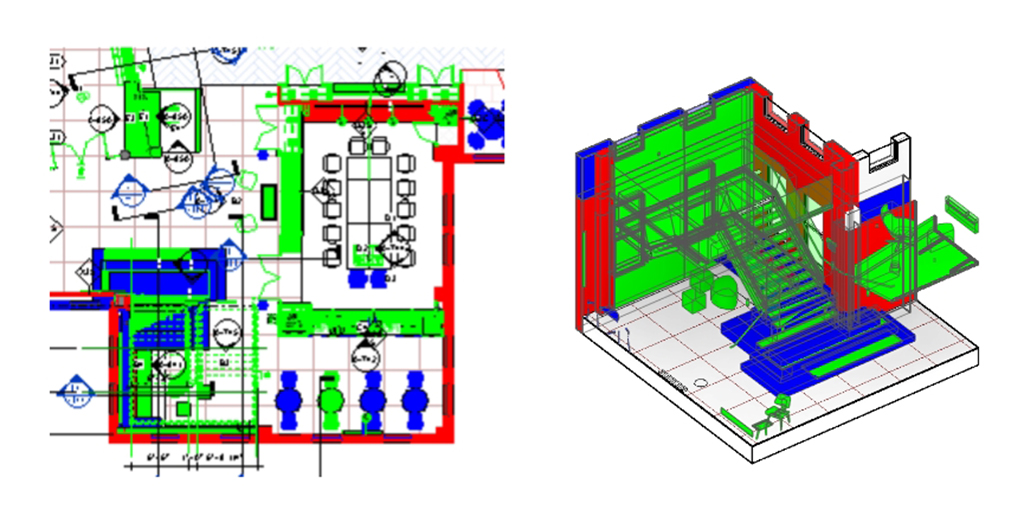
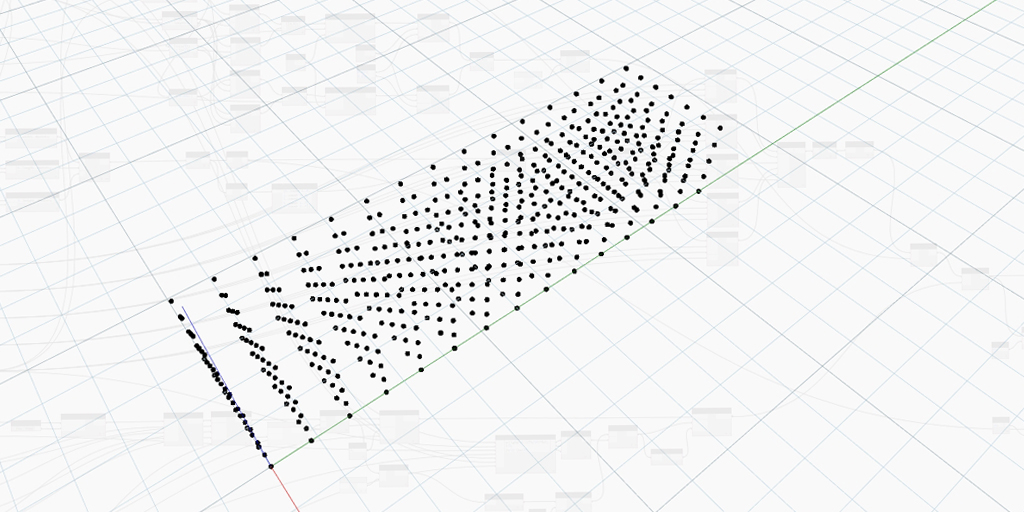
OBJECTIVES: Target specific rooms in the Revit model by Room Number, isolate the exterior Wall/Window elements specific to that room, calculate total area of exterior facade for each Room, understand composition of vision to solid materials, and assist with code calculations such as light & ventilation.
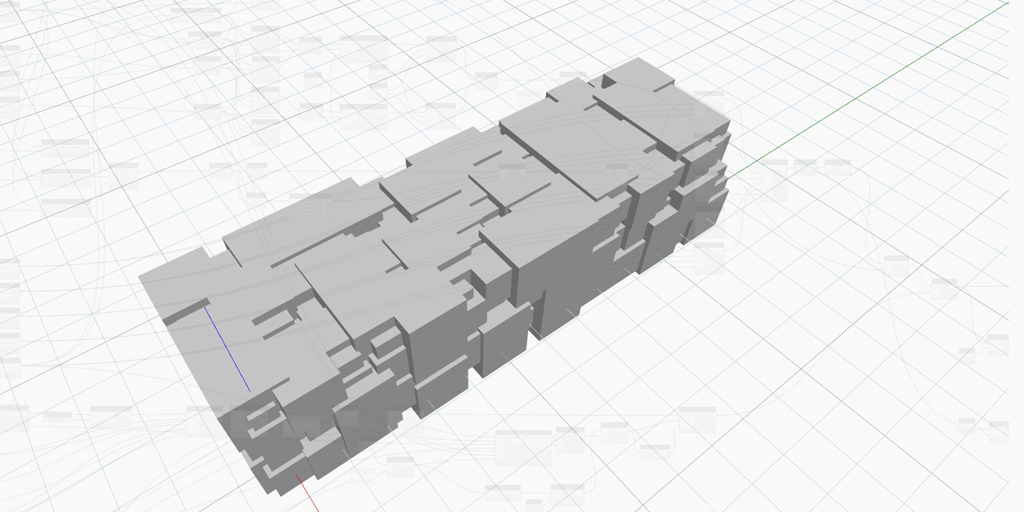
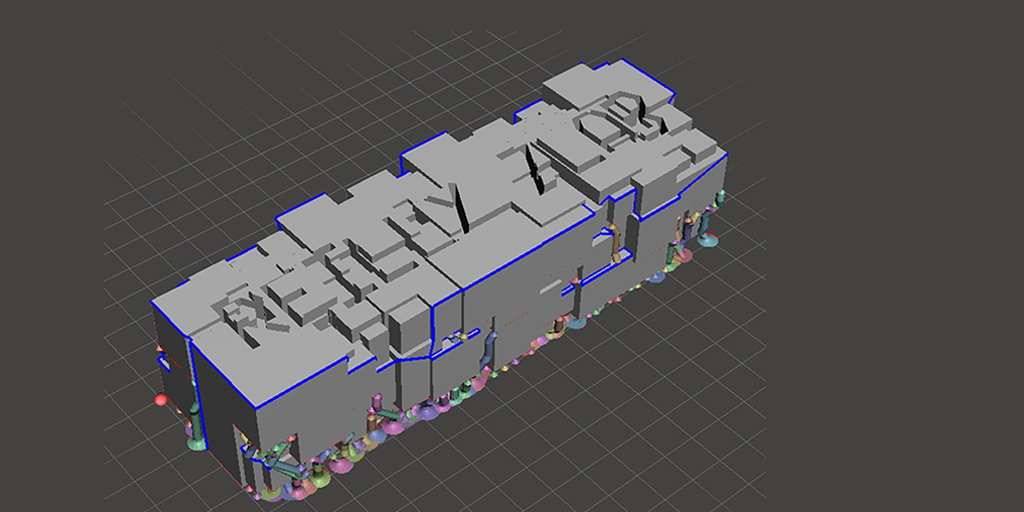
OBJECTIVES: Query all exterior Wall elements, use the underlying geometry to determine direction of each wall, sort walls by cardinal directions or bespoke orientation system, and calculate proportion of facade areas for each direction.

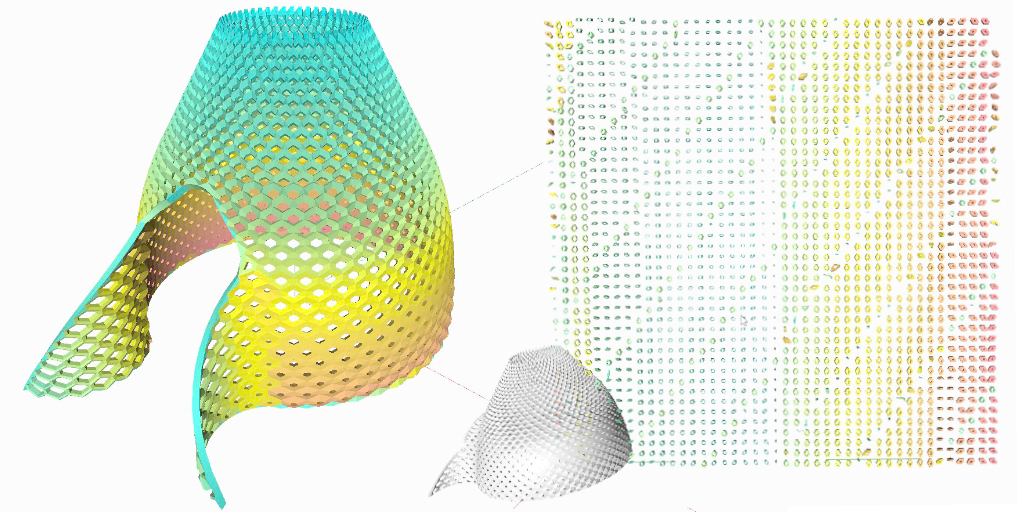
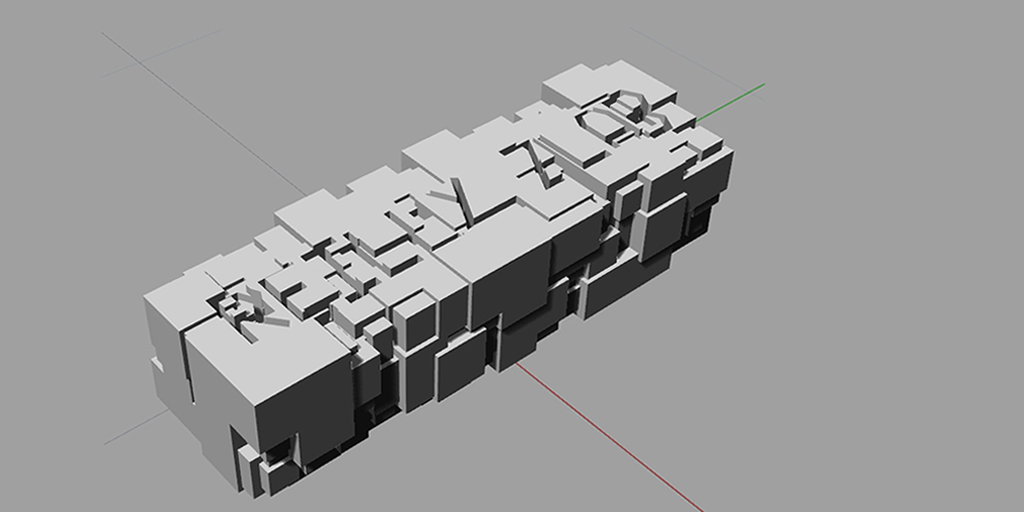
OBJECTIVE: Color specific items for analysis, visual clarity, and storytelling
The live demonstration was recorded for your viewing pleasure. You may notice the video starts a little late due to technical difficulties but no significant content was missed. Presentation slides and the Dynamo file can be accessed HERE.
Even with a rush towards the end, I was able to successfully make it through all the content. I appreciate the audience being super receptive and patient given the hands-off format. And a very special thank you Timon Hazell, John Schippers, and Dana De Fillippi for the opportunity.

DynamoDC audience

Kyle's "home studio" setup
The other day I received a surprise t-shirt in the mail as a thank-you, I will wear it with pride!