Rectangular ACT ceiling grid alignment is a task that frequently occurs during the design and documentation of architecture projects in Revit. After a ceiling has been placed, the typical approach involves creating a dimension string between two parallel walls and one of the gridlines in the ACT ceiling, selecting the dimension, and clicking the EQ symbol that automatically centers that gridline between the surrounding walls. This process must then be repeated for the perpendicular orientation.

For a more efficient workflow using Dynamo:
- create a new Generic Model family
- in the family editor, go to the Manage tab > Object Styles
- in the Object Styles menu under Model Objects, click New under Modify Subcategories
- name the new object DYNAMO and change the color to something bright that will be easily identified in the RCPs
- in elevation, create a new reference plane and connect a dimension string between this and the Ref. Level
- in plan, draw a rectangle the same size as one ACT tile (1’x1’, 2’x4’, etc.)
- also draw a line at the midpoint of each direction to determine the center point of one tile
- make sure that the lines are assigned to the upper reference plane so that they will be positioned near to the ceiling
- in the Family Types dialogue, create a new parameter for Offset Height — this will be assigned to the dimension string in elevation and will determine the offset distance from the floor to the ceiling. It can be a Type parameter (same for EVERY instance of the family) or an Instance parameter, which would place at a default height and then allow adjustments for ceiling height variation in the project.

Not all projects are perfectly orthogonal. In some cases, there may be a defined angular shift in portions of the building, if not many unique angles. A secondary group of lines could be copied and pasted to the same place then assigned On/Off visibility parameters for an orthogonal and angled variation of the family. An instance parameter for the angle would allow for a custom rotation of up to 90 degrees on every instance in the project.


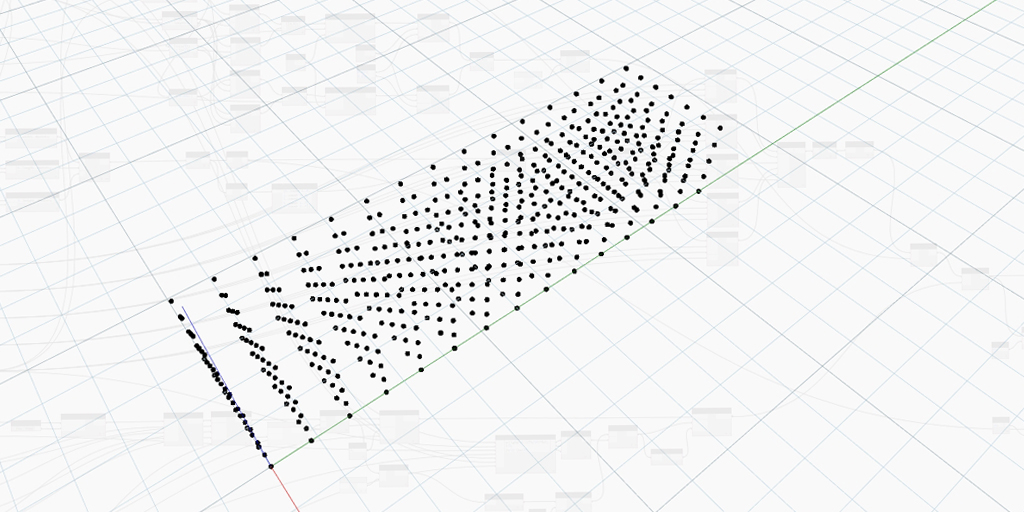
Once your family is completed, save and load into the Revit model. A Dynamo definition can then be built that targets ceiling elements in the model, queries their center point, and places the alignment family.

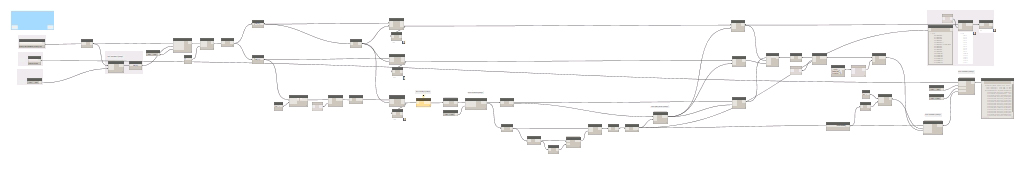
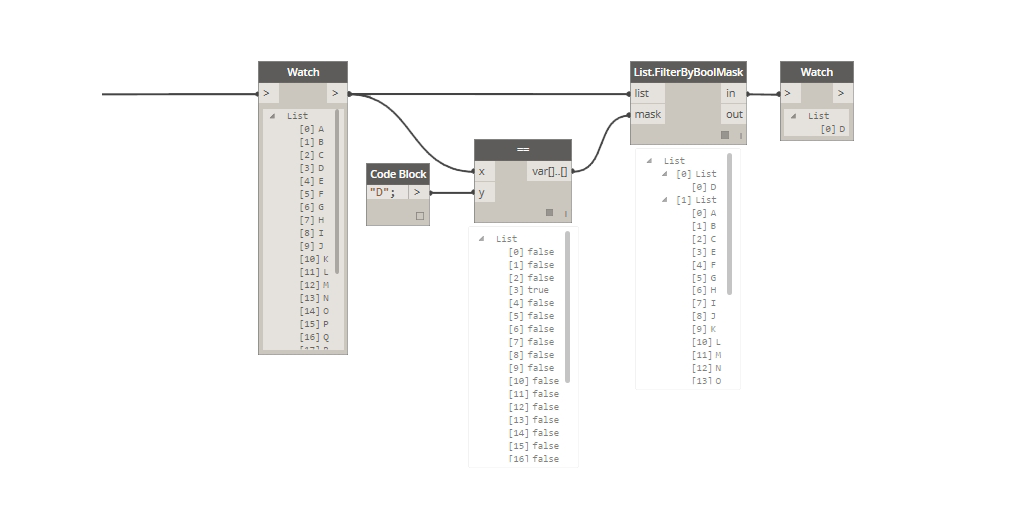
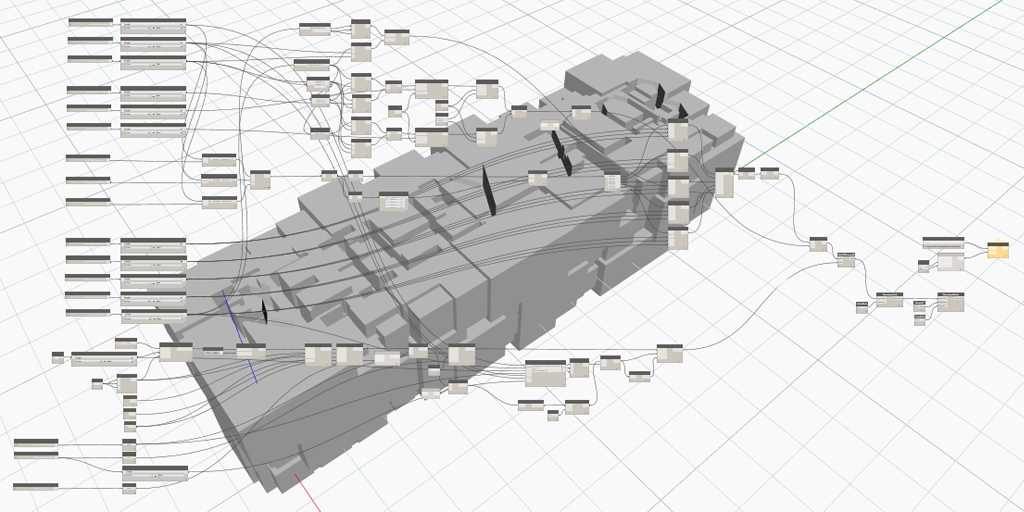
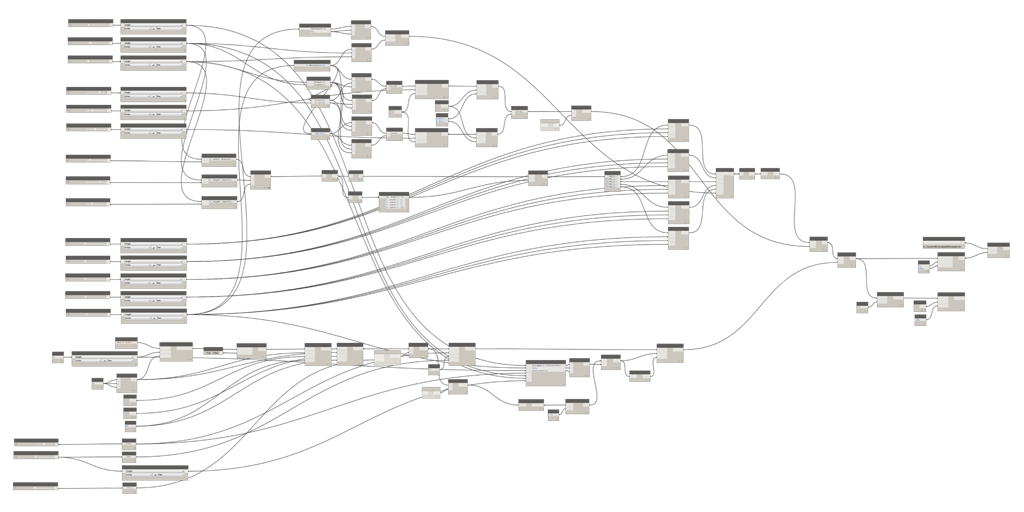
Ceiling Alignment - Dynamo Definition (hi-res image available HERE)
I chose to specifically isolate ceilings by Type and also by Level. This helps cut down on the requisite computation power and time that it takes the task to run. Another advantage is being able to open an RCP view, watch the families instantiate, and verify that everything has been configured correctly in Dynamo.

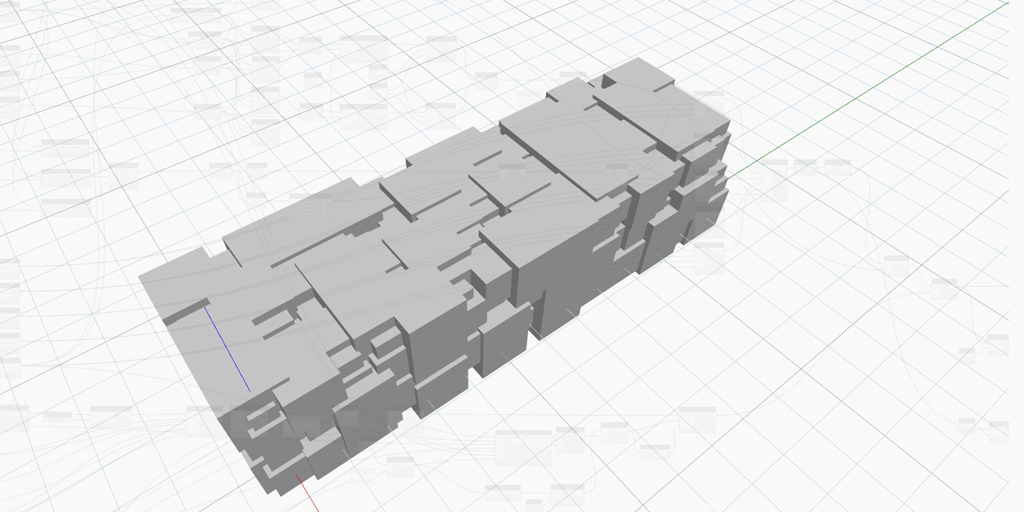
After the alignment families have been placed, users on the team can begin the task of manually aligning the ceiling grids to the red box. If it is determined that there is not sufficient space between the gridline nearest to the perimeter walls, the centerline crosshair of the family can be used instead to perfectly center the ceiling grid in the room instead.
Because the lines in the alignment family have been created with the name DYNAMO under the Generic Models category, it is easy to turn off their visibility through the project for final documentation via the View Template. Additionally, if ceiling have shifted and the positioning of the families becomes obsolete over time, it is easy to select one instance, right-click and select all in the view or project, then delete them entirely.


Given a minimum of 5 mouse clicks for the traditional process, selecting the Align tool (or typing the AL hotkey), picking a line on the alignment family, and then a gridline requires a few less clicks. Multiplied over dozens or even hundreds of ceilings throughout the project, this approach is vastly more efficient and removes the need for extra decision making.
One must still manually account for the minimum distance between the perimeter walls and the grid. And obviously this approach is not ideal on L-shaped and irregular ceiling profiles. However, the majority of ceilings in projects are rectangles and Dynamo can help production staff quickly work through an entire RCP full of ceilings so they can quickly apply their time to other pressing matters.